Pages

Wednesday, December 14, 2016

Support @ 8150 & 8130

Dear All,

>>> Nifty Hourly Chart <<<

>>> Click the chart to see on full screen <<<

Price need to hold the support @ 8180, 8160 & 8130.

>>> Axis Bank - Posted Yesterday <<<

>>> Click the chart to see on full screen <<<

Wrote Yesterday - Price on a Break out - for the second time. See what Happened.

>>> Axis Bank - Booked Profit Rs.22800/- <<<

>>> Click the chart to see on full screen <<<

Booked with Rs.22800/- Profit. Cheers!!!

Tuesday, December 13, 2016

Key Support @ 8150. Resistance @ 8230 & 8250

Dear All,

>>> Nifty Hourly Chart <<<

>>> Click the chart to see on full screen <<<

As wrote Yesterday - Price took support @ 8150 and started moving near 8230. Above 8230 may test 8250 as shown on chart.

>>> Bank Nifty Hourly Chart <<<

>>> Click the chart to see on full screen <<<

If holds above 18460 - may test 18650 soon.

>>> CNX-IT - Break Out <<<

>>> Click the chart to see on full screen <<<

Clear break out visible - if holds above the channel - more rally on card as mentioned on chart.


>>> AXISBANK - Break Out - We are Long Again <<<

>>> Click the chart to see on full screen <<<

Break out for the Second time after many bad news and consolidation - We are long and holding for a good Profit. Cheers!!!

Monday, December 12, 2016

Support @ 8150

Dear All,

>>> Nifty 5 Mins Chart <<<

>>> Click the chart to see on full screen <<<

Support @ 8150.

Saturday, December 10, 2016

Weekly Review - 12th Dec, 2016

Dear All,


It has been a choppy ride for the Indian equity markets that had been hit by the double whammy of demonetisation and the surprise victory of Donald Trump in the US Presidential elections, exactly a month ago on November 8. India’s Nifty (down 3.5%) was the second worst performing index in Asia after Philippines, and the fourth globally – after Mexico (down 5.9%), Brazil (4.3%) and Philippines (down 3.9%).

Markets will now depend on US Fed rate action, Union Budget 2017, growth in corporate earnings, progress made as regards the goods and services tax (GST) bill. Though the market has priced in a 25 basis point rate hike by the US Federal Reserve in December 2016, it is not prepared for an aggressive guidance for CY 2017.

>>> Nifty Weekly Chart - Posted Last Week <<<

>>> click the chart to see on full screen <<<

Wrote last week - Price made a double confirmation on candle sticks side. Lets see what happened this week.

>>> Nifty Weekly Chart - Happened <<<

>>> click the chart to see on full screen <<<

Price made a strong close than previous candle high and confirmed the Bulls Strength. Close above 50 & 100 WMA also give more strength.

>>> Nifty Daily Chart <<<

>>> click the chart to see on full screen <<<

Price constantly moving above 200 DMA - may test 8340,8390 and 8420 next week.

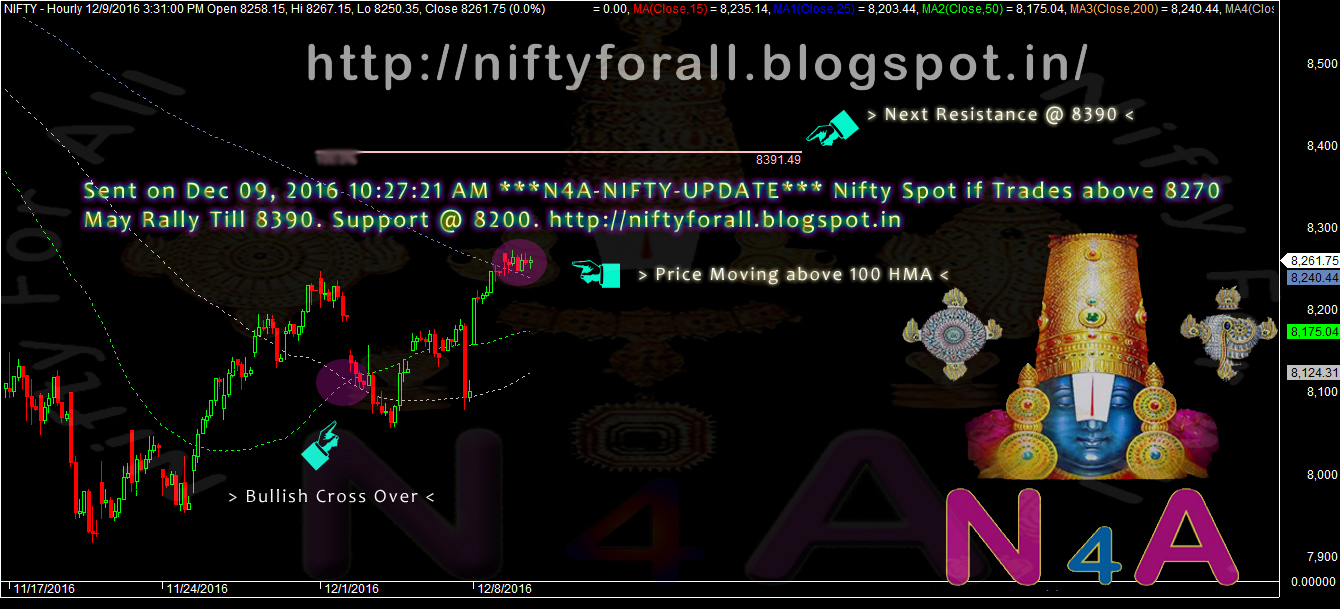
>>> Nifty Hourly Chart <<<

>>> click the chart to see on full screen <<<

Price moving above 200 HMA, may possibly test 8390 or above.

>>> Bank Nifty Weekly - Posted Last Weekly Review <<<

>>> click the chart to see on full screen <<<

Price made a Bullish hammer last week - See what happened.

>>> Bank Nifty Weekly Chart - Happened <<<

>>> click the chart to see on full screen <<<

Price almost test 61.8% for Wave (x) or (4) as shown above. A Bullish candle shows more rally possible.

>>> BankNifty Daily = Posted Last Weekly Review <<<

>>> click the chart to see on full screen <<<

Bank Nifty almost inside the channel - Wrote last week - Price may take support @ the channel or may test 17750 on worst case. See what happened.

>>> Bank Nifty Daily Happened <<<

>>> click the chart to see on full screen <<<

Price started moving above the channel shows some strength, may continue its rally next week also.

>>> Bank Nifty Hourly <<<

>>> click the chart to see on full screen <<<

Bank Nifty Hourly - If able to cross above 18750 - More Fire Works Possible.

>>> CNX-IT Posted on 08th Dec, 2016 <<<

>>> click the chart to see on full screen <<<

Wrote on 08th Dec, We have entered long and expecting price to move up. See what happened.

>>> CNX-IT - Booked Profit Rs.10,000/- <<<

>>> click the chart to see on full screen <<<

Booked Rs.10,000/- Profit - Price gave a break out as shown on above chart - More rally possible.

>>> SBIN - Hourly Chart - Posted on 30th Nov, 2016 <<<

>>> click the chart to see on full screen <<<

Posted on 30th Nov, about possible rally on SBI. See what happened.

>>> SBIN - Booked Profit Rs.30,000/- <<<

>>> click the chart to see on full screen <<<

Profit booked @ 265 with Rs.30,000/- Profit.

>>> Performance till 09th Dec, 2016 <<<


Above performance is not a Promise or guarantee for the given Profits or Loss.Performance given based on 1 lot at a time and clients Profit differ as per the margin availability and Number of Lots taken by them. We may or may not re-enter the Calls given here hit Stop Loss, as per market movement. The charts given above are just for educational purpose only and we don't recommend any Entry / Buy or Exit / Sell. Reader must taken their own decision or consult their qualified Analyst before making any decision


Send your Service queries to niftyforall@yahoo.com or whatsapp @ 9677924975

Thursday, December 08, 2016

Above 8250 - 8260 - More Rally & Short Covering.

Dear All,


>>> Nifty Hourly Chart <<<

>>> Click the chart to see on full screen <<<

Price resisted @ 8250. More Rally & Short Covering possible - if crosses above 8250-60. We are Holding our Long.

>>> Bank Nifty Hourly Chart <<<

>>> Click the chart to see on full screen <<<

Bank Nifty - may decide the entire market movement in coming days. Price need to break above 18700+ for a healthy rally, still more banks are showing weakness and yet to give strength.

>>> NIFTY - IT - Hourly Chart <<<

>>> Click the chart to see on full screen <<<

We are long in Nifty IT also. Above 9950 More rally coming. Lets See. Cheers!!!

Wednesday, December 07, 2016

Must Hold 8080, Else May Test 8000 Again

Dear All,

>>> Nifty Hourly Chart <<<

>>> Click the chart to see on full screen <<<

Of course again it looks like a Head & Shoulder. So in case if breaks trend line along with 8080, price may test 8000 or previous low 7930 also. If holds, may re bounce and cross above recent high 8250. News Flow and economic events may dictate the trend. Cheers!!!

Tuesday, December 06, 2016

Resistance @ 8175-8185. Support @ 8080

Dear All,

>>> Nifty Hourly Chart <<<

>>> Click the chart to see on full screen <<<

Price must cross above 8175-8185 for a Good Rally. Support 8132 and 8080 if breaks - Fresh Fall to resume. Cheers!!!

Monday, December 05, 2016

Resistance @ 8150 & 8185

Dear All,

>>> Nifty Hourly Chart <<<

>>> Click the chart to see on full screen <<<

Price holding the Support Line, If holds and if able to cross above 8150 and 8185 - More Rally on card. If breaks below the support line Price may re-test the previous low.

>>> Bank Nifty Hourly Chart <<<

>>> Click the chart to see on full screen <<<

Key Resistance @ 18490 and 18700. Price must break and hold the trend line and RSI as shown on above chart.

Saturday, December 03, 2016

Weekly Review - 05th Dec, 2016

Dear All,


Foreign institutional investors (FIIs) have been continuous sellers since November 9, a day after the government announced demonetisation. FIIs have pulled out Rs 18,800 crore in the previous 17 sessions, one of their longest unbroken selling streaks.

Foreign investors sold shares worth Rs 190 crore on Friday, provisional data provided by stock exchanges showed. Domestic investors, too, were net sellers to the tune of Rs 419 crore.

Investors will react to solid US jobs data, which has strengthened the prospects of rate hike by US Federal Reserve later this month. Investors will also eye developments in Italy, which heads to the polls on Sunday to pass or reject reforms that Prime Minister Matteo Renzi says are needed to move the country forward. RBI’s policy review on December 7 will also be a focal point for investors reeling from the government’s clampdown on high-value currency bills and capital outflows.

>>> Nifty Weekly Chart <<<

>>> Click the chart to see on full screen <<<

Last Two Weeks Candle Sticks confirmed a Bullish Trend. Hammer and an Inverted Hammer - on the bottom of the chart suggest a Bullish Reversal.

>>> Nifty Daily Chart <<<

>>> Click the chart to see on full screen <<<

Price took support near 7930 was halted near 8250 last week. Since the wave structures are complicated with lot of alternatives - One must be careful with every support and resistance - since the entire market moving highly volatile as per news flow.

>>> Nifty Hourly Chart <<<

>>> Click the chart to see on full screen <<<

Bulls must defend 8066 and 8050 for its survival. Else Price may possibly retest its previous low. Resistance 8250 if able to cross again may trigger another round of rally and short covering.

>>> Bank Nifty Weekly Chart <<<

>>> Click the chart to see on full screen <<<

Though the Sentiments and news flow are battering the Bank Nifty Index Every day - Chart holding its support 18200 for third time or for the 4th week - shows some light. Above inverted Hammer on BN Index - again give a hope for a Possible Upmove.

>>> Bank Nifty Daily Chart <<<

>>> Click the chart to see on full screen <<<

Price if breaks below the channel support - may test 17750-60, Else Bulls may gain strength for a Good Rally.

>>> Bank Nifty Hourly Chart <<<

>>> Click the chart to see on full screen <<<

So above count shows a complicated abc-x-abc corrective move, If this is not wrong, expect a bounce any time next week.

>>> AdaniPort - Hourly Chart - Booked Profit Rs.17500/- <<<

>>> Click the chart to see on full screen <<<

We have no Open position in AdaniPort - May or may not re-enter as per movement next week. But if breaks below 264 next week, expect more fall.

>>> Performance for the month end of November 2016 <<<

>>> Click the chart to see on full screen <<<

Above performance is not a Promise or guarantee for the given Profits or Loss.Performance given based on 1 lot at a time and clients Profit differ as per the margin availability and Number of Lots taken by them. We may or may not re-enter the Calls given here hit Stop Loss, as per market movement. The charts given above are just for educational purpose only and we don't recommend any Entry / Buy or Exit / Sell. Reader must taken their own decision or consult their qualified Analyst before making any decision.


Friday, December 02, 2016

Support 8180 if breaks May test 8135 & 8100

Dear All,

>>> Nifty Hourly Chart <<<

>>> Click the chart to see on full screen <<<

Support 8180 if breaks may test 8135 & 8100 as shown on above chart.

Wednesday, November 30, 2016

Next Resistance @ 8257 & 8337

Dear All,

>>> Nifty Daily Chart - Price Crossed above 200 DMA <<<

>>> Click the chart to see on full screen <<<

Price managed to cross above 200 DMA - shows more rally coming. RSI gave a clear break out. Next Resistance @ 8257 & 8337.

>>> Bank Nifty Hourly Chart - We are Long <<<

>>> Click the chart to see on full screen <<<

We are long with nearly 300+ Points profit. Price gave a clear break out shows more rally possible.

>>> Axis Bank Hourly - Posted on 28th Nov, 2016 <<<

>>> Click the chart to see on full screen <<<

Posted on 28th Nov, 2016 - Axis Bank may rally any time. See what happened.

>>> Axis Bank - Rally Possible - Hold Long <<<

>>> Click the chart to see on full screen <<<

Price should break above the triangle - for a fresh rally and short covering.

>>> SBIN - Ready for Break Out <<<

>>> Click the chart to see on full screen <<<

We are long in SBIN and holding for a Break out as shown on above chart. Cheers!!!

Tuesday, November 29, 2016

Support @ 8140,8104 & 8075

Dear All,

>>> Nifty 5 Mins Chart <<<

>>> Click the chart to see on full screen <<<

Today we booked our Long near 8180 with 200 Points Profit. We are long since 7980. Now 8140 Support if breaks, possibly may test 8104 and 8075.

>>> HDFC - Posted on 27th Nov, 2016 <<<

>>> Click the chart to see on full screen <<<

Posted on 27th Nov, that - after a lot of consolidation - Price may hit the top of the channel - as shown above on chart. See what happened.

>>> HDFC - Booked Profit Rs.17500 <<<

>>> Click the chart to see on full screen <<<

Price hit the channel top and we booked Rs.17500/- Profit. Cheesr!!!