Pages

Sunday, May 14, 2017

Weekly Review - 15th May, 2017

Dear All,


Following are the major factor in determining market movement in the coming week.

Economic indicators :-
The two key economic numbers –IIP and inflation – which were released on Friday after market hours are likely to have a bearing on the domestic stock market when it opens for trading on Monday. The CPI-based inflation dropped to a multi-year low of 2.99 per cent in April, putting pressure on RBI to cut interest rate after it took a hawkish stance in last policy review, citing upside risk to prices. Retail inflation stood at 5.47 per cent in April 2016.

On similar lines, the wholesale price index (WPI)-based inflation slipped to a four-month low of 3.85 per cent in April, as both food articles and manufactured items showed cooling in prices.

However, the industrial output data dampened the spirits as the numbers slipped to a four-month low contracting 1.2 per cent in February because of a decline in the manufacturing sector and lower offtake of capital as well as consumer goods, said a PTI report.

The Index of Industrial Production (IIP) had registered a 1.99 per cent growth in February last year. This apart, the government is expected to announce trade data for April on Monday (May 15).

Global cues :-
On the global front, China’s industrial production data for March 2017 is scheduled for release on Monday. US industrial production data for April 2017 is likely to be announced on Tuesday. Japan’s industrial production data for March 2017 is expected on Wednesday and the US initial jobless claims for the week ended May 12, 2017, is coming out on Thursday i.e. May 18.

>>> Nifty Daily Chart <<<

>>> Click the chart to see on full screen <<<

Above chart waved as 1-5, Need to confirm the end of 5th wave. Possibilities of extension can't be ruled out.

>>> Nifty Hourly Chart - Posted on 11th May, 2017 <<<

>>> Click the chart to see on full screen <<<

Posted - as the Price Resisted @ 9450.

>>> Nifty Hourly Chart - What's Next <<<

>>> Click the chart to see on full screen <<<

As expected Price took support @ trend line, a break below, may trigger more correction.

>>> Bank Nifty Daily - Posted Last Weekly Review <<<

>>> Click the chart to see on full screen <<<

Bank Nifty posted last weekly review - 22920 as a Key Resistance.

>>> Bank Nifty Daily - What's Next <<<

>>> Click the chart to see on full screen <<<

22920 tested might be an end for wave 3. If the analysis is not wrong - expect a good correction.

>>> Nifty-IT - Hourly Chart <<<

>>> Click the chart to see on full screen <<<

CNX-IT Looks like some more bullishness left, Possibly may test 10437 & 10580. We Have no Position.

>>> HindZinc - Booked Rs.32000/- <<<

>>> Click the chart to see on full screen <<<

Booked Rs.32000/-, Though We may re-enter again as per movement.

>>> Tata Elxsi - Daily Chart - We are Long <<<

>>> Click the chart to see on full screen <<<

We are Long for a Good Rally.

>>> Performance till 12th May, 2017 <<<

>>> Click the image to see on full screen <<<

Above performance is not a Promise or guarantee for the given Profits or Loss.Performance given based on 1 lot at a time and clients Profit differ as per the margin availability and Number of Lots taken by them. We may or may not re-enter the Calls given here hit Stop Loss, as per market movement. The charts given above are just for educational purpose only and we don't recommend any Entry / Buy or Exit / Sell. Reader must taken their own decision or consult their qualified Analyst before making any decision


Thursday, May 11, 2017

Support @ 9380 & 9365

Dear All,


>>> Nifty Hourly Chart - Posted Yesterday <<<

>>> Click the chart to see on full screen <<<

Wrote Yeterday - Price may test 9450.

>>> Nifty Hourly Chart <<<

>>> Click the chart to see on full screen <<<

As Expected Price Tested 9450, Next if breaks the trend line - expect some correction.

>>> HindZinc - Posted on 09th May, 2017 <<<

>>> Click the chart to see on full screen <<<

Wrote on 09th May - We are Long in HindZinc.

>>> HindZinc - Booked Profit Rs.32000/- today <<<

>>> Click the chart to see on full screen <<<

Wednesday, May 10, 2017

Next 9450

Dear All,

>>> Nifty Hourly Chart <<<

>>> Click the chart to see on full screen <<<

Above 9370 > Price to test 9450.

Tuesday, May 09, 2017

Resistance @ 9335 - 9350 - 9370. Support @ 9270

Dear All,

>>> Nifty Hourly Chart - Posted on Weekly Chart <<<

>>> Click the chart to see on full screen <<<

Wrote on Weekly Review - Support 9270 needs to break for a fall.

>>> Nifty Hourly Chart - Happened <<<

>>> Click the chart to see on full screen <<<

So far 9270 not yet Broken - But Bulls need to cross above Resistance 9335 - 9350 - 9370 for a Healthy Upmove.

>>> CNX-IT Posted on Weekly Review <<<

>>> Click the chart to see on full screen <<<

Posted on Weekly Review - We are Holding long for a Rally.

>>> CNX-IT - Today Booked Profit with 280 Points <<<

>>> Click the chart to see on full screen <<<

Booked 280 Points Profit today, May or May not Re-Enter as per movement.

>>> INFY - Posted on Weekly Review <<<

>>> Click the chart to see on full screen <<<

Posted on 24th April - Price may bounce and We are Long.

>>> INFY - Booked Profit @ 948 with Rs.13000/- Profit <<<

>>> Click the chart to see on full screen <<<

Booked Profit 948 Yesterday with Rs.13000/-

>>> HindZinc - Long Again <<<

>>> Click the chart to see on full screen <<<

We are Long again in HindZinc - Hoping for a Good Rally. Cheers!!!

Sunday, May 07, 2017

Weekly Review 08th Monday, 2017

Dear All,


Key factors that are likely to dictate market direction in the coming week.

French Presidential Election Outcome: This one event has the potential to make the markets across the globe oscillate between the two extremes.

France heads for final round of voting on Sunday to elect its next president where centrist Emmanuel Macron will face off against far-right candidate Marine Le Pen, who has said she would pull the country from out of the European Union, a potentially destabilising move for markets.

Opinion polls indicate voters will pick Emmanuel Macron, a 39-year-old ex-economy minister who wants to bridge the left-right divide, resisting an anti-establishment tide that has seen Britons vote to leave the EU and Americans choose Donald Trump as US president, said a Reuters report.

US Payroll Data: In a major boost to the American economy, the US reported a joyous figure of unemployment rate dropping to 4.4 per cent, near a 10-year low. The job growth rebounded sharply in April, bolstering the Federal Reserve's stand of raising interest rates in the next policy meet.

The drop of one-tenth of a percentage point in the jobless rate took it to its lowest level since May 2007 and well below the most recent Federal Reserve median forecast for full employment.

Earnings:- Industry heavyweights Bharti Airtel, HCL Technologies, Hero MotoCorp, Asian Paints and Dr Reddy's Laboratories are slated to release their March quarter earnings in the coming week. So far, majority of companies have reported better-than-expected results for the last quarter. Investors are likely to have a keen eye on the results before taking any position during the week.

Macroeconomic Data: The government is expected to announce industrial production data for March after market hours on Friday.

The industrial output slipped to a 4-month low contracting by 1.2 per cent in February because of decline in the manufacturing sector and lower offtake of capital as well as consumer goods. The Index of Industrial Production (IIP) had registered a growth of 1.99 per cent in February last year.

The Consumer Price-based Inflation (CPI) for April 2017 is also scheduled to release on the same day. The retail inflation rose to a 5-month high of 3.81 per cent in March against 3.65 per cent in February.

Hudco IPO to hit D-St on Monday: State-owned Housing and Urban Development Corporation (Hudco), a 'Miniratna' firm which provides loans for housing and urban infrastructure projects, will launch the IPO on May 8 where the government is offering 204,058,747 shares for sale.

It has fixed the price band of Rs 56-60 per equity share. The issue will close on May 11.

Global Cues: In the US, Cleveland Federal Reserve President Loretta Mester is expected to speak about the economic outlook and monetary policy at the Chicago Council on Global Affairs Public Breakfast Program -- From Main Street to Wall Street: Economic Growth, Monetary Policy, and the Federal Reserve, in Chicago IL, on Monday, 8 May 2017.

Also, Bank of England (BoE) will announce monetary policy decision summary and minutes of the monetary policy committee meeting held on May 10 on Thursday. It will also announce inflation report for May 2017.

Note :-

So far we have seen many bearish counts, Since then Price kept breaching the Resistance and continue to move ahead. Though there is a lot of Choppiness and Volatile prevails in market, Lets see some alternative Bullish Count also. This week discussed here are some of the Alternative Bullish Counts, might be possible around the near future.

>>> Nifty Weekly Chart <<<

>>> Click the chart to see on full screen <<<

After a lot of violation on Bearish count - Next Bullish alternative is given above. As said earlier - the current uptrend is highly complicated wave count, hence a high trust on bull or bear is a dangerous view.

>>> Nifty Daily Chart <<<

>>> Click the chart to see on full screen <<<

Might be an 1-5 or ABC UPmove - Possibly a correction may occur before testing the channel top.

>>> Nifty Hourly Chart - Posted on 04th May, 2017 <<<

>>> Click the chart to see on full screen <<<

Wrote on 04th May, 2017 > Price if unable to cross above 9367-70 - Expect a possible correction till 9270.

>>> Nifty Hourly Chart - More fall if breaks 9270 <<<

>>> Click the chart to see on full screen <<<

Price resisted @ 9370 and tested a low of 9273. Break below 9270 may test the gap left.

>>> Bank Nifty Weekly Chart <<<

>>> Click the chart to see on full screen <<<

Like Nifty - above is an Alternative Count for BN. So After Break Out as shown on chart - it seems Price moving towards 24770

>>> Bank Nifty Daily Chart <<<

>>> Click the chart to see on full screen <<<

Above 22590 may test 22920.

>>> CNXIT - Daily Chart <<<

>>> Click the chart to see on full screen <<<

Holding Trend line Support, may rally further.

>>> INFY - Daily - Posted on 24th April 2017 <<<

>>> Click the chart to see on full screen <<<

Still Holding Long.

>>> N4A - Services <<<


Thursday, May 04, 2017

Key Resistance @ 9370 & Support @ 9270

Dear All,

>>> Nifty Hourly Chart <<<

>>> Click the chart to see on full screen <<<

Previous High 9367-70 Must take off for a New Rally, Else may re-test 9270 or may even fill the gap as shown on chart.

>>> Bank Nifty - Posted on Weekly Review <<<

>>> Click the chart to see on full screen <<<

Wrote on Weekly Review - Price may test 22420 & 22590 if trades above 22340 - So what's Next ??

>>> Bank Nifty - What's Next <<<

>>> Click the chart to see on full screen <<<

Above 22590 - May test 22920. Cheers!!!

Wednesday, May 03, 2017

Support 9300 Must Hold for Upmove.

Dear All,

>>> Nifty Hourly Chart <<<

>>> Click the chart to see on full screen <<<

9300 must hold for Bulls strength. Else Price may repeat as previous Wave - as shown on chart. Support @ 9260 - 9225 - 9195.

>>> CNXIT - Daily Chart <<<

>>> Click the chart to see on full screen <<<

We are Long since 10,000 and holding for a Good Rally. As per above chart - Price took support from the trend line - must hold.

>>> Just Dial - Posted on Weekly Review <<<

>>> Click the chart to see on full screen <<<

Posted on Weekly Review - Just Dial - Should hold the support for a Possible Revival. See what happened today.

>>> Just Dial - Ready for Break Out <<<

>>> Click the chart to see on full screen <<<

Price - If breaks above the Wedge - Get ready for a Fresh Rally and Short Covering - We are Holding our Long.

Sunday, April 30, 2017

Weekly Review - 02nd, May 2017

Dear All,


Key Factors that may sway your market through the week:-

No love lost between the US & N Korea: Triggering another bout of tension, North Korea testfired a ballistic missile on Saturday shortly after US Secretary of State Rex Tillerson warned that failure to curb Pyongyang's nuclear and ballistic missile programmes could lead to "catastrophic consequences".

However, the US and South Korean officials said the test appeared to have failed, in what would be the North's fourth straight unsuccessful missile test since March.

Earlier on Thursday, the US President Donald Trump had said a "major, major conflict" with North Korea was possible over its nuclear and ballistic missile programmes, while China said the situation on the Korean peninsula could escalate or slip out of control.

Economic data:- Markit Economics will announce the India Manufacturing Purchasing Managers' Index (PMI) data for April 2017 on Tuesday. It will also unveil the results of a monthly survey on the performance of India's services sector in April 2017 on Thursday.

Global cues:- On the global front, a host of economic data is slated to release in the coming week, giving direction to the market movement. First of all, the minutes of the Bank of Japan's (BOJ) Monetary Policy meeting will be released on Monday, May 1. China Caixin manufacturing PMI data for the month of March 2017 will be announced on Tuesday; The US Markit Composite index for the month of April is scheduled to release a day after i.e. on Wednesday. Also, the US nonfarm payrolls data for April 2017 is expected to release on Friday.

Realty Act comes into effect:- The long-awaited Real Estate (Regulation and Development) Act (RERA) will be implemented from May 1. The Act specifies that all existing projects must be registered with the state's regulatory authority by July 2017, and that no new project can be launched without this registration.

Each state and Union Territory will have its own Regulatory Authority (RA) which will frame regulations and rules according to the Act. It’s difficult to comment on the quantum of impact this Act will have on the domestic stocks but realty shares are likely to grab limelight.

OMC and auto stocks to play key role: State-run oil marketing companies (PSU OMCs) will be in focus as PSU oil marketing companies will undertake fuel price revision towards the closing of this month. As reported earlier, they are expected to introduce a daily revision of petrol and diesel prices in select markets, on a pilot basis from May 1.

Auto stocks will be in focus as auto companies will start reporting sales volume data for April 2017, starting from Monday, 1 May 2017.

>>> Nifty Weekly Chart - Posted Last Weekly Review <<<

>>> Click the chart to see on full screen <<<

Posted Last weekly review - 9120 as a good support.

>>> Nifty Weekly Review - Happened. <<<

>>> Click the chart to see on full screen <<<

Price managed to Hold 9120 and started bouncing - RSI must support bulls.

>>> Nifty Daily Chart <<<

>>> Click the chart to see on full screen <<<

On Daily basis - 9350-67 - Crucial Resistance.

>>> Nifty Hourly Chart <<<

>>> Click the chart to see on full screen <<<

On Hourly Chart - We have two alternative - either it may an ABCDE or 1-5. Price may try to fill the gap left - if breaks below 9300 again.

>>> Bank Nifty Daily Chart <<<

>>> Click the chart to see on full screen <<<

Its a most Extensive Wave - Hard to count, If this is not wrong - We might see some consolidation.

>>> Bank Nifty Hourly Chart - Posted Last Weekly Review <<<

>>> Click the chart to see on full screen <<<

Above chart - Posted on last weekly review - Wrote - Looks for a good bounce back. See what happened.

>>> Bank Nifty Hourly Chart - Happened <<<

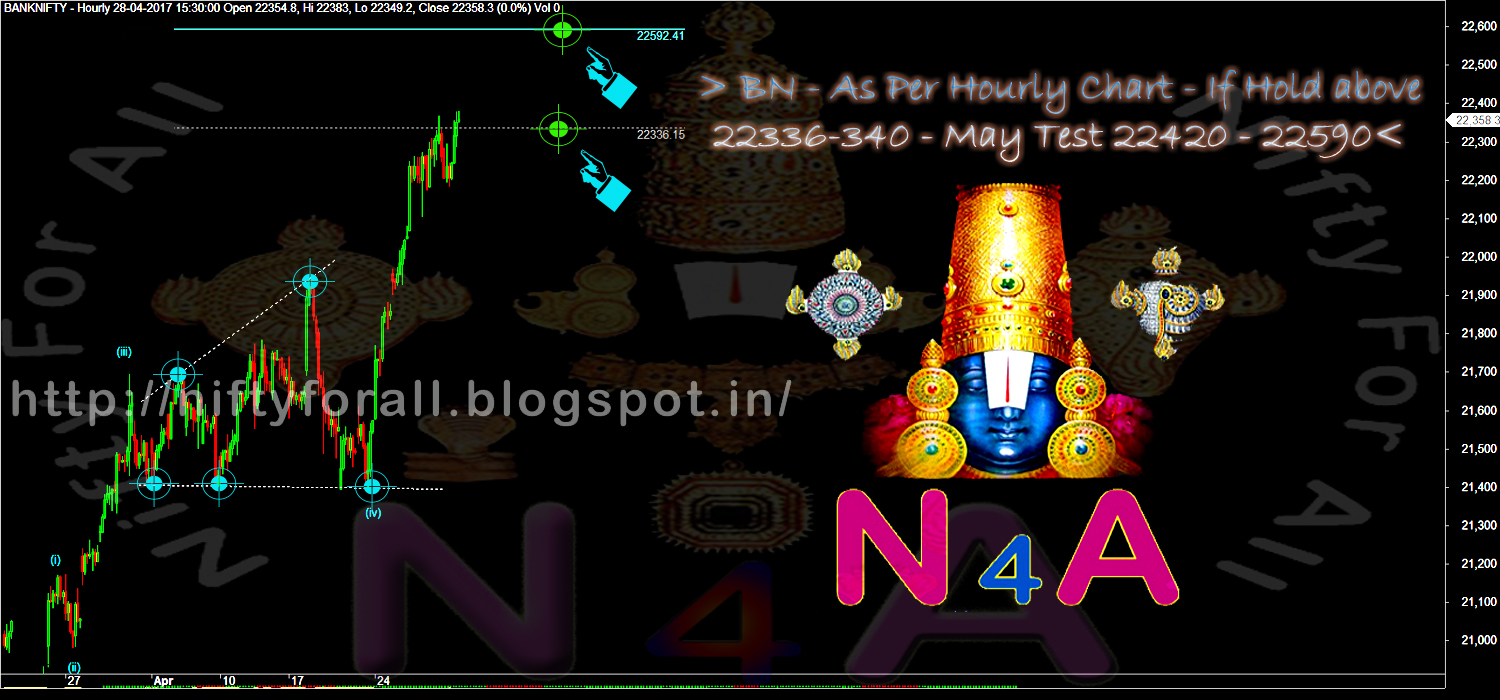
>>> Click the chart to see on full screen <<<

BN - above 22340 - may test 22420 or 22590 as shown above.

>>> MindTree - Booked Profit Rs.40,000/- <<<

>>> Click the chart to see on full screen <<<

Booked Rs.40,000/- Profit on Mind Tree.

>>> Just Dial - Again we are Long <<<

>>> Click the chart to see on full screen <<<

A week before - after making a good profit, Have re-entered Just Dial again.

>>> INFY - Holding Long <<<

>>> Click the chart to see on full screen <<<

Continue to Hold Long.

>>> Performance for the month end of Apil 2017 <<<

>>> Click the image to see on full screen <<<

Above performance is not a Promise or guarantee for the given Profits or Loss.Performance given based on 1 lot at a time and clients Profit differ as per the margin availability and Number of Lots taken by them. We may or may not re-enter the Calls given here hit Stop Loss, as per market movement. The charts given above are just for educational purpose only and we don't recommend any Entry / Buy or Exit / Sell. Reader must taken their own decision or consult their qualified Analyst before making any decision

>>> N4A-Services <<<