Pages

Sunday, June 18, 2017

Weekly Review - 19th June, 2016

Dear All,


>>> Nifty-Weekly-Chart <<<

>>> Click the chart to see on full screen <<<

Price Unable to cross the crucial resistance @ 9660 on Weekly basis.

>>> Nifty-Daily-Chart <<<

>>> Click the chart to see on full screen <<<

Daily Chart shows Support @ 9560 & 9530. Resistance 9800 and 9925.

>>> Nifty-Hourly-Chart <<<

>>> Click the chart to see on full screen <<<

Support 9560 and 9530 if manage to hold - Should cross above 9620 and 9660 for a Rally.

>>> Bank-Nifty-Daily-Chart <<<

>>> Click the chart to see on full screen <<<

Price made a clear break out above channel shows a lot more rally pending.

>>> CNX-PSUBank-Daily-Chart <<<

>>> Click the chart to see on full screen <<<

Last week also wrote - PSU Bank Index on a Crucial Support @ 3420. Break below may trigger correction in all PSU Bank Stocks.

>>> CNX-PSUBANK-Hourly-Chart <<<

>>> Click the chart to see on full screen <<<

150+ Points Rally Possible if manage to hold 3420. All PSU Bank Stocks may also rally.

>>> CanBK-Hourly-Chart - Profit Booked Rs.17000/- <<<

>>> Click the chart to see on full screen <<<

Booked Profit 17K on CanBK Long. Possible rally if trades above 356 and 358.

>>>CNX-IT-Daily-Chart <<<

>>> Click the chart to see on full screen <<<

Nifty IT Failed to hold 10330 and followed by a good correction on TCS. Next Support @ 10140.

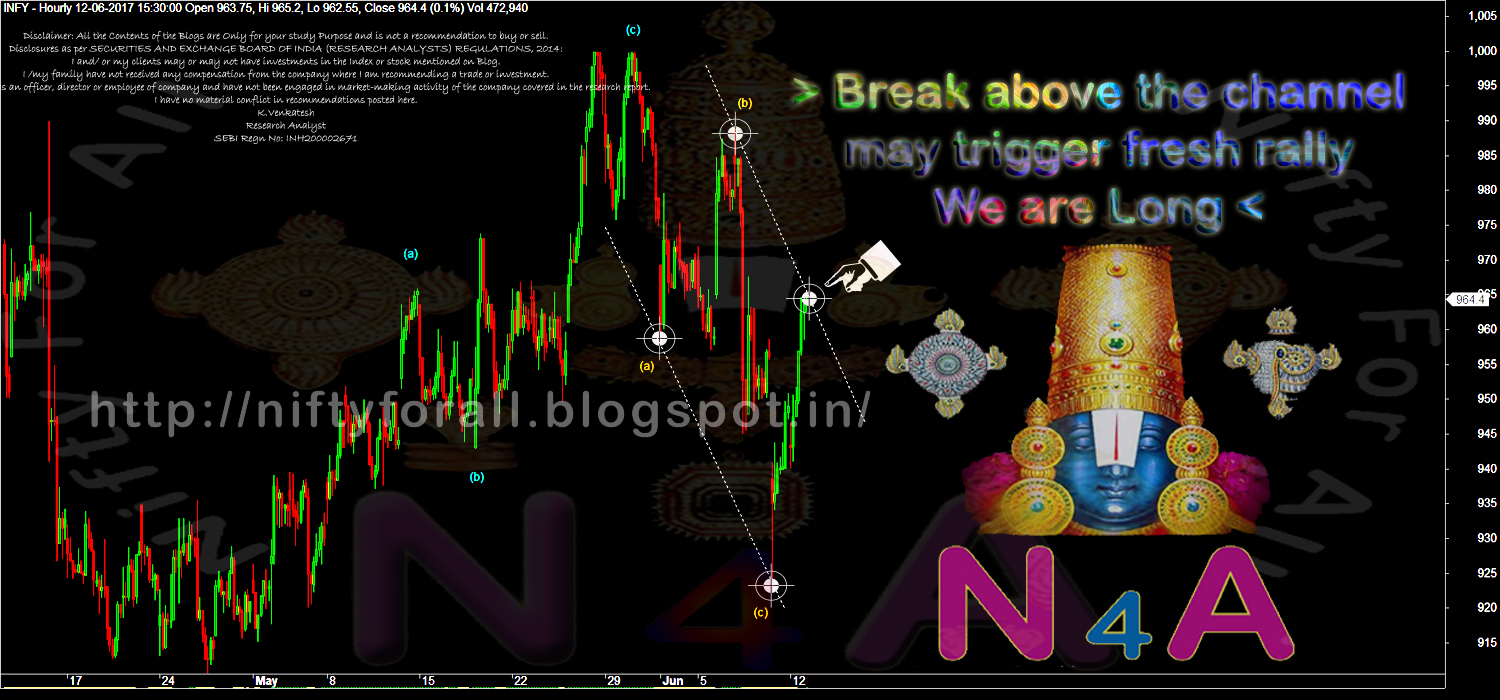
>>> INFY-Hourly-Chart - Posted on 12th June, 2017 <<<
>>> Click the chart to see on full screen <<<

Wrote on 12th June - INFY may really.

>>> INFY - SL hit and Exited <<<

>>> Click the chart to see on full screen <<<

We have exited long. Next support @ 930-32.

>>> ASIANPAINTS - HOLDING LONG <<<

>>> Click the chart to see on full screen <<<

Holding Long.

>>> CNX-MIDCAP50 - Daily Chart <<<

>>> Click the chart to see on full screen <<<


MidCap Index on a Crucial Point 4645-4650. If manage to cross may trigger fresh rally, else may correct 400+ Points, which may trigger a fall in all Mid Cap Stocks.

>>> RelCapital - Hourly Chart <<<

>>> Click the chart to see on full screen <<<

Start MidCap Stock - RelCapital - If Corrects - May trigger sell off in MidCap Index too. Lets wait and see.

>>> Performance till 16th June 2017 <<<


Above performance is not a Promise or guarantee for the given Profits or Loss.Performance given based on 1 lot at a time and clients Profit differ as per the margin availability and Number of Lots taken by them. We may or may not re-enter the Calls given here hit Stop Loss, as per market movement. The charts given above are just for educational purpose only and we don't recommend any Entry / Buy or Exit / Sell. Reader must taken their own decision or consult their qualified Analyst before making any decision

Thursday, June 15, 2017

Support @ 9560

Dear All,

>>> Nifty 5 Mins Chart - Posted on 13th June, 2017 <<<

>>> Click the chart to see on full screen <<<

Wrote 9560 as a Support as a Channel support.

>>> Nifty 5 mins Chart - 9560 Support Tested <<<

>>> Click the chart to see on full screen <<<

Price test 9560 as expected, Break below may test 9525.

Wednesday, June 14, 2017

Support Taken @ 9580. Resistance @ 9640 - 9660

Dear All,

>>> Nifty Hourly Chart <<<

>>> Click the chart to see on full screen <<<

Its a Good consolidation move, took support @ 9580. Should break above the channel for a rally, might be above 9640 or 9660.

>>> PSU Bank Index Posted on Weekly Review <<<

>>> Click the chart to see on full screen <<<

Posted on Weekly Review - PSU Bank Index Support @ 3420.

>>> PSU Bank Index May Rally - Also PSU Bank Stocks <<<

>>> Click the chart to see on full screen <<<

Hourly chart shows - Price took support @ 3434. Govt. initiative to Merge some PSU Bank may trigger a good rally in PSU Bank index.


>>> CANBK - Hourly Chart - We are Long <<<

>>> Click the chart to see on full screen <<<

We are Long and Holding for a good target.

>>> ASIANPAINTS - Hourly Chart - We are Long <<<

>>> Click the chart to see on full screen <<<

We are long. Price if gives a break out above the wedge like pattern - then IHS may be the case. If this pattern is not wrong - Expect a Good Rally in short time.

>>> ESCORTS - Booked Profit Rs.17600/- <<<

>>> Click the chart to see on full screen <<<

Booked on Escort Short today with Rs.17600/- Profit. More Correction Possible. Cheers!!!


Tuesday, June 13, 2017

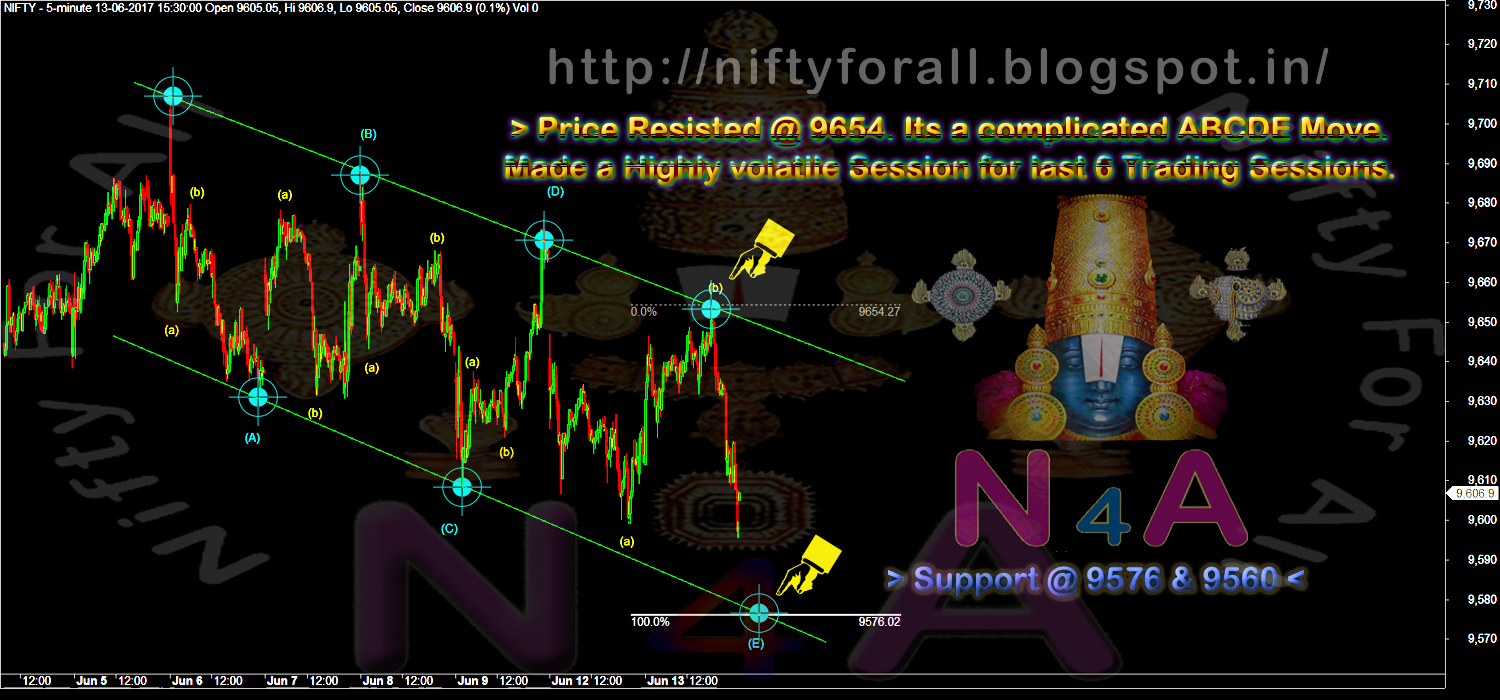
Support @ 9576 & 9560

Dear All,

>>> Nifty 5 Mins Chart <<<


>>> Click the chart to see on full screen <<<


Its a complicated ABCDE move for last 6 trading session. It manage to hold the support @ 9576 & 9560 - Expect a good bounce. Cheers!!!

Monday, June 12, 2017

CNX-IT Got Support @ 10330, Get Ready for Rally

Dear All,

>>> NIFTY IT - Posted on Weekly Review <<<


>>> Click the chart to see on full screen <<<


Wrote 10330 as a good support for Nifty IT.

>>> NIFTY IT - Expect a Good Rally <<<


>>> Click the chart to see on full screen <<<

Price must hold 10330 for a Fresh Rally.

>>> INFY - We are Long for a Fresh Rally <<<

>>> Click the chart to see on full screen <<<

We are Long for a Rally, for a Channel Break Out

Saturday, June 10, 2017

Weekly Review - 12th June, 2016

Dear All,


This week the US Fed will meet to decide interest rates, if any. The US is running at more or less at the highest rate of employment which makes a strong case for interest rate cuts, which if done, would cause some worldwide selling in equities and India will not remain immune. GST rollout will be a massive challenge in a country as large and as India, it will throw up short-term spanners in the growth momentum, just like what demonetisation did during the second last quarter of the previous year.

>>> Nifty Weekly Chart <<<

>>> Click the chart to see on full screen <<<

Price facing a Crucial Resistance @ 9660-9680 on Weekly Basis. Cross above may trigger a Fresh Rally till 10300 and 11400.

>>> Nifty Daily Chart <<<

>>> Click the chart to see on full screen <<<

Daily Chart Shows - More Rally coming in Next Week also. Possibly 9800 and 9930. We are Long.

>>> Bank Nifty Weekly <<<

>>> Click the chart to see on full screen <<<

25950 might be a Possible Target for Bank Nifty as per Weekly Chart.

>>> Bank Nifty Daily Chart <<<

>>> Click the chart to see on full screen <<<

Price may test 24775 to complete its Wave (c)or(3) on the Daily Chart.

>>> CNX-IT - Weekly Chart <<<

>>> Click the chart to see on full screen <<<

Price made a Break out on Weekly Chart - Later on made a reversal. Tested 100 and 50 WMA.

>>> CNX-Daily Chart <<<

>>> Click the chart to see on full screen <<<

Price if manage to get support @ 10330 & 10140, Expect a Reversal, Resistance 10760.

>>> CNX Pharma - Posted on 01st June 2017 <<<

>>> Click the chart to see on full screen <<<

Posted on 01st June, 2017 - That Pharma has completed its downside - Wrote to Bottom Fishing for all Pharma Stocks.

>>> CNX Pharma - Daily Chart - More Rally Coming <

>>> Click the chart to see on full screen <<<

Price may rally further till 9950 - Hence Expect more rally on Pharma Stocks too. Buy on Every Dips.

>>> PSU Bank Index - Daily Chart <<<

For the first time, Rs 6,000 crore of bad loans from PSU banks has been put out to auction, and the winning ARC (asset reconstruction company) will have to pay 50 per cent cash upfront and balance 50 per cent in a staggered manner. This is the first concrete action after a long time. If done successfully, it would herald a new chapter in the revival of PSU banks’ fortunes. And shareholders will also rejoice. Even SBI recapitalised itself by coming out with a Rs 15,000 crore QIP, keeping all stakeholder interest in mind.

So let's See how the PSU Bank Index to Perform as per its Index

>>> Click the chart to see on full screen <<<


PSU Bank Index Support @ 3420, if breaks may test 3150. Expect all PSU Bank to correct.

>>> PFC - Hold Long <<<

>>> Click the chart to see on full screen <<<

Continue to Hold Long till the price break below the channel support, Break above Resistance may give fresh rally.

>>> Performance till 09th June, 2017 <<<

>>> Click the chart to see on full screen <<<

Above performance is not a Promise or guarantee for the given Profits or Loss.Performance given based on 1 lot at a time and clients Profit differ as per the margin availability and Number of Lots taken by them. We may or may not re-enter the Calls given here hit Stop Loss, as per market movement. The charts given above are just for educational purpose only and we don't recommend any Entry / Buy or Exit / Sell. Reader must taken their own decision or consult their qualified Analyst before making any decision


Thursday, June 08, 2017

Support @ 9620 & 9570

Dear All,


>>> Nifty Hourly Chart <<<

>>> Click the chart to see on full screen <<<


9620 if breaks may test 9570 and 9525.


>>> PFC Hourly Chart - Posted on Weekly Review <<<

>>> Click the chart to see on full screen <<<


Posted on Weekly Review - Stocks may rally soon.

>>> PFC Hourly Chart - Hold Long <<<


>>> Click the chart to see on full screen <<<


Possible for more rally, We are holding our long.

>>> CNX-IT - Hourly Chart <<<


>>> Click the chart to see on full screen <<<


Nifty IT may get support from 10460 & 10330.

Wednesday, June 07, 2017

More Rally Possible on Bank Nifty till 24000+

Dear All,


>>> Bank Nifty Daily - Posted on Weekly Review <<<

>>> Click the chart to see on full screen <<<

Posted on weekly review - Price above 23460 may trigger next round of rally.

>>> Bank Nifty Daily - More Rally Possible <<<

>>> Click the chart to see on full screen <<<

Price Close above 23460 shows more rally possible till 24060-70.

>>> INFY Hourly Chart - We are Long <<<


>>> Click the chart to see on full screen <<<

We are Long and holding for a Fresh Rally & Short Covering. Cheers!!!


Tuesday, June 06, 2017

Support @ 9620 7 9570. Resistance @ 9680.

Dear All,

>>> Nifty Hourly Chart <<<

>>> Click the chart to see on full screen <<<

Price moving on a Negative Divergence. 9680 Resisted and if breaks support 9620 may test 9570 and 9525.

>>> CNX-IT - Posted on Weekly Review <<<

>>> Click the chart to see on full screen <<<


Earlier on Weekly Review - Mentioned as - IT Index need to break on either side for a Good and Fresh Rally.

>>> CNX-IT - Daily Chart - Break Out & Fresh Rally Possible <<<

>>> Click the chart to see on full screen <<<

Break Out above Triangle - Shows Fresh rally or 500+ Points Possible.

>>> DCBBank - Daily Chart - Booked Profit Today Rs.22500/- <<<

>>> Click the chart to see on full screen <<<

We have No position now Earlier We Shorted and today we booked Profit 22500/-.

>>> PFC - Holding Long <<<

>>> Click the chart to see on full screen <<<

Holding Long after Break Out. Cheers!!!