Pages

Thursday, November 23, 2017

Resistance @ 10375 & 10415.

Dear All,

>>> Nifty 5 Mins Chart <<<

>>> Click the chart to see on full screen <<<

Volatile Move - Hence 5 mins chart give - tried best to find out the direction. Resistance @ 10375 and 10415. Support @ 10290-300.


Wednesday, November 22, 2017

Resistance @ 10340 - 380

Dear All,

>>> Nifty Hourly Chart <<<

>>> Click the chart to see on full screen <<<

Price may rally above the triangle break out.

>>> ULTRACEMCO - Hourly Chart <<<

>>> Click the chart to see on full screen <<<

Holding Long and Looking for More Rally. Cheers!!!

Tuesday, November 21, 2017

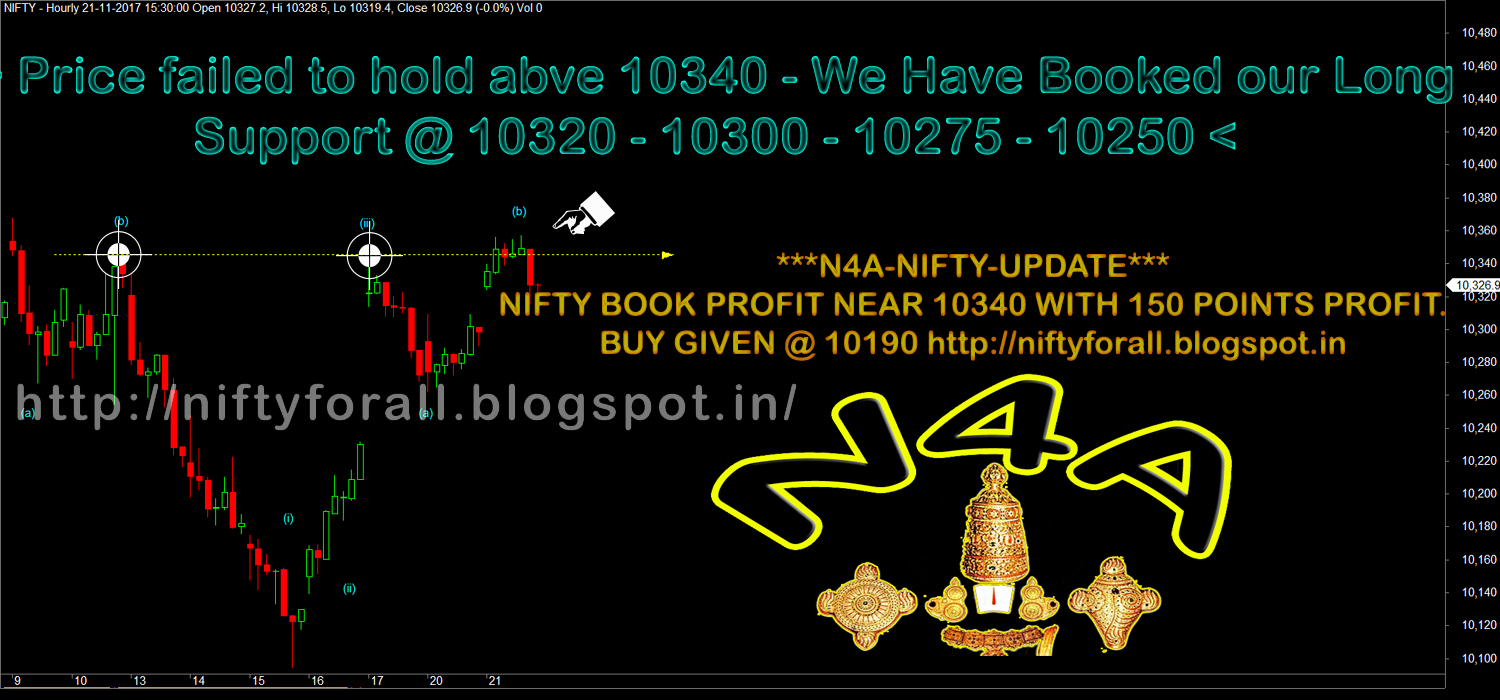
Not Holding Above 10340

Dear All,

>>> Nifty Hourly Chart <<<

>>> click the chart to see on full screen <<<

We have booked our Long today with 150 Points Profit. Price may consolidate further if unable to cross above 10340 again.

>>> Bank Nifty Hourly Chart <<<

>>> click the chart to see on full screen <<<

Must cross above 25925 for further upmove. Booked our Long with 490 Points Profit.

>>> SunPharma - Posted on Weekly Review <<<

>>> click the chart to see on full screen <<<

Posted on Weekly Review - We are Long.

>>> SunPharma - Hourly Chart - Booked Profit Rs.20,000/- <<<

>>> click the chart to see on full screen <<<

Booked Profit with Rs.20000/-.


Sunday, November 19, 2017

Weekly Review - 20th November - 2017

Dear All,


Here are the seven most common errors traders make in a bull market.

They wait for a correction to get long that never happens. So they end up missing a big part of the up trend.
They do not get long with a big enough position size or enough leverage so they end up underperforming the market.
They do not buy the small dips when they get a chance.
Perma bears do not believe in the bullish move higher so they sell short losing money in a market where it should be made easily by being long.
Some fundamentalists think the market is too expensive so they stay in cash missing a strong up trend as they wait for buying opportunities at better values.
When the dip they were waiting for finally happens they are too scared to buy it and they then begin to fear that the market will crash.
Instead of making money too many get obsessed with calling a market crash because they believe the market prices are too damn high.
The best strategy for a bull market is to not fight it but instead sit back and enjoy the ride.

>>> Key Events :- <<<

After Moody's, other rating agencies' move will be watched

India's sovereign credit rating upgrade by Moody’s to 'Baa2' from 'Baa3' for first time since 2004 and change in its outlook on the rating to stable from positive, citing continued progress in economic and institutional reforms on Friday cheered the markets.Now the market will watch that the move of other rating agencies.
Currently Standard and Poor's has a BBB- rating on India since 2007 and stable outlook. It had upgraded India's sovereign rating to stable from negative in 2014, especially after Modi government came in power.Fitch has kept its BBB- rating unchanged for 11 years on India, and retained stable outlook since 2013.BBB- is one notch above Junk.

Macro Data :-

Consumer price index for rural and farm labourers for October will be released on November 20. Crude, refinery output for October and Mobile subscriber data for October will be announced during November 20-24. Foreign exchange reserves for the week ended November 17 and bank loan growth & deposits growth for the week ended November 10 will be announced on Friday.

FIIs & DIIs flow and F&O Data :=

Foreign institutional investors bought nearly Rs 6,000 crore worth of shares and DIIs purchased Rs 3,451 crore worth of equities in the week gone by, due to stable September quarter earnings and Moody's India rating upgrade.

On Friday, maximum Call open interest (OI) of 59.98 lakh contracts was seen at strike price 10,500, which will act as a crucial resistance level for the index in the November series, followed by 10,400, which now holds 51.68 lakh contracts in open interest, and 10,600, which has accumulated 42.81 lakh contracts in OI.

Maximum Put OI of 48.77 lakh contracts was seen at strike price 10,000 which will act as a crucial base for the index in November series, followed by 10,200, which has accumulated 47.69 lakh contracts in open interest, and 10,300, which now holds 46.23 lakh contracts in open interest.

Global Cues :-

Japanese trade balance data (imports and exports) will be announced on Monday. US existing home sales data will be released on Tuesday while US durable goods orders, US unemployment claims, US crude oil inventories and US FOMC meeting minutes will be announced on Wednesday.

Europe's Manufacturing and Services PMI, and ECB Monetary Policy Meeting Minutes will be unveiled on Thursday.Japan's Manufacturing PMI, and US Manufacturing and Services PMI data will be released on Friday.US and Japanese markets will remain shut on Thursday for Thanksgiving Day.

>>> Nifty Daily Chart <<<

>>> Click the chart to see on full screen <<<

Above 10340 - 10400 More rally and New High Possible.

>>> Nifty Hourly Chart <<<

>>> Click the chart to see on full screen <<<

Possible double top or Resistance 10340 must be crossed again for a fresh rally. Key Support @ 10260 and 10240.

>>> Bank Nifty Daily Chart <<<

>>> Click the chart to see on full screen <<<

Above 25925 - More Rally Again.

>>> Bank Nifty Hourly Chart <<<

>>> Click the chart to see on full screen <<<

Support @ 25640 - 25580 - must hold. Resistance 25925 if breaks again may trigger next round of rally.

>>> Nifty MidCap50 - Daily Chart <<<

>>> Click the chart to see on full screen <<<

MidCap Index mainly contains Financials and Infra Stocks. After Moody's Upgrade and Govt. Commitment to Help PSU Banks - Lifting the Midcap sentiments. 5120,5105 and 5090 to give support. Above 5175 - Fresh Rally Possible.


>>> CNXIT - Daily Chart <<<

>>> Click the chart to see on full screen <<<

A new legislation in the United States—which proposes to increase minimum wages, paid to foreign tech workers employed in the country on H1B visas, from $60,000 to $90,000—has set off alarm bells in India with the National Association of Software and Services Companies (NASSCOM), saying that the proposed law is “arbitrarily targeting” Indian companies which took up only a small portion of these visas last year.

Major Indian IT companies paid project managers between $85,000 and $130,000 in the US last year — with salaries varying between US states — while technology leads were paid between $65,000 and $100,000, and systems engineers around $ 65,000, according to data available online.

Above news doesn't sounds good for Indian IT Companies. Above chart suggest if breaks the support - Possible sell off in all IT companies.

>>> CNXPharma - Hourly Chart <<<

>>> Click the chart to see on full screen <<<

Pharma Index Support @ 9130-9107-9080 - If holds - May bounce again. Watch all Pharma Stocks

>>> SunPharma - Hourly Chart - Holding Long <<<

>>> Click the chart to see on full screen <<<

Support @ 514 - 511 - 506 if holds - upmove possible.

>>> CNXPSUBanks - Daily Chart <<<

>>> Click the chart to see on full screen <<<

Only above 4190 - Rally may start.

>>> N4A - Whatsapp <<<

Send your request with name and Location. Those who already registered - If not receiving messages - Should save this number and ping us.




Thursday, November 16, 2017

Support @ 10180. Resistance @ 10245 - 10290 - 10340 - 10400

Dear All,

>>> Nifty Hourly Chart - Posted Yesterday <<<

>>> Click the chart to see on full screen <<<

Yesterday wrote - its a Light at the end of the tunnel. As expected Price bounce today.

>>> Nifty Hourly Chart - More Rally on card <<<

>>> Click the chart to see on full screen <<<

Price made a good break out, may test 10245 - 10290 - 10340 - 10400. Support @ 10180

>>> Bank Nifty Hourly Chart <<<

>>> Click the chart to see on full screen <<<

We are Long again. Break out the Channel top - will trigger a lot of rally.

>>> SunPharma - Hourly Chart <<<

>>> Click the chart to see on full screen <<<

We are Long. Break above the wedge - may trigger a fresh rally and short covering. cheers!!!

Support @ 10090. Resistance @ 10150 - 10190 - 10220.

Dear All,

>>> Nifty Hourly Chart <<<

>>> click the chart to see on full screen <<<

Support if 10090 holds - expect a bounce backtill 10150 - 10190 - 10220. Lets See.

>>> CNX-Pharma - Hourly Chart <<<

>>> click the chart to see on full screen <<<

Pharma Index on a Key support - If holds - Expect all Pharma Stocks and Index to Bounce back again.

>>> CNX - Metal - Hourly Chart <<<

>>> click the chart to see on full screen <<<

Metal stocks are on key support - Expect a bounce back on all metal stocks and index also. Cheers!!!

Tuesday, November 14, 2017

Support @ 10180 - 10160 - 10140

Dear All,

>>> Nifty 5 Mins Chart <<<

>>> Click the chart to see on full screen <<<

Above 5 mins chart - might be an end of ABC correction. If so may hold support 10180 - 10160 or 10140.

>>> Bank Nifty Hourly Chart <<<

>>> Click the chart to see on full screen <<<

Bank Nifty - If holds 25225 & 25120 - Upmove possible. We have covered short with 150 Points Profit today.

Sunday, November 12, 2017

Weekly Review 13th November 2017

Dear All,


Trading Bubbles and Panics :-

Greed can push prices far above any reasonable fundamental valuation. Fear can take prices lower than investors would have thought possible.

Trend traders make money in the markets not because they predict anything but because they buy what is going up and they sell what is going down. They discover ways to measure and react to trends based on historical price data and current price action. Trend traders identify a signal and enter a trade with predefined risk for the trade and make a plan on how to exit based on the capital at risk per trade and a price level that will tell them that they were wrong. Their goal is to be on the right side of huge market trends that are outside the standard bell curve of possibilities. When stubborn traders blow up because they have stubbornly bet on the wrong side of the market the trend trader wants to be on the other side of their trade. When a big trader or fund is in a position that moves against them day after day, week and week, and they are praying for a bounce or reversal in their losing position the trend trader wants to be on the other side of them.

The trends that blew up Long Term Capital Management, Amaranth, and Baring Bank had trend traders on the other side of the trades. What destroyed some traders made other rich, where do you think all that money went that they lost? Their losses went to the people on the other side of their trades. Bubbles and panics are caused by fear and greed running in one direction for an extended period of time. If a commodity starts to lock limit up or limit down day after day you should know there is a trend trader making money somewhere while other traders are praying for a reversal. Trend traders make their biggest profits when they are on the right side of a bubble or a crash.

What causes a “bubble”? Whether it is tulips in Holland, the South Sea Bubble in Great Britain, or the Dot Com bubble or housing bubble in the United States the principles stay the same. Investors and traders have capital that they want to put to work, they choose to buy what they think will appreciate in value. As more and more capital flows into an asset it goes up in value as more outside money wants in to a limited supply of a commodity, stock, house, or tulip. Markets go up for only one reason: that the current seller is not willing to sell for the current market price and the buyer is willing to pay more. Market prices move up because sellers will not sell for the current price and buyers are willing to pay more to get in.

The financial markets are an auction that work through asks and bids to buy and sell it is not a retail store where management sets the prices for everyone, supply and demand make price discovery happen on every trade. Many times a bubble will start when future expectations start being priced into a current market. As expectations rise prices can also rise for no real fundamental reason. When prices reach all time highs there is no real selling pressure because everyone is holding for a profit. The only thing that can slow down the price advance is profit taking as no stop losses are getting hit as higher highs in price are made. As long as new buyers are willing to buy at higher prices the bubble will continue to inflate. Trend traders don’t care why; they are just along for the ride.

Bubbles have everything to do with the holders and new buyers expectations of making money in the future not fundamentals. The reason people buy into a market bubble is that they believe they will be able to sell it for a higher price later. Bubbles are bought into and are driven up on the belief of higher prices in the future. Outside of commodity and option hedgers the only reason people buy is for a later profit. When the belief of a later profit ends so does the bubble and rising prices as the market runs out of new buyers at the elevated prices. The selling starts slowly but escalates as stop losses and trailing stops are hit first then profit taking panic slowly sets in. Euphoria is the fuel of bubbles.

The flip side of the bubble is the market crash. Fear and panic are the drivers of downtrends that overshoot low prices that people didn’t think were even possible. When the stock market starts going down fast, investors are not pulling up balance sheets and figuring out what should be a company’s stock valuation, they are selling their holdings after losing a lot of money. During panics price declines accelerate due to people’s fear of losing even more money. The downtrends are caused by individual investors making the personal decision to sell not after carefully study of the macro economic situation but because they want to stop losing money. Trend traders do not care why a market is down they are selling it short because the price action tells them to.

Many traders and investors are unable to make a lot of money in a bubble because they will sell short believing that prices will have to revert to the mean in price. Many also can’t buy into a bubble because the market is too expensive based on fundamental valuations. Other investors and traders lose a lot of money during market crashes because they try to buy a dip in price and all they end up accomplishing is being trapped in at higher prices as market prices continue to plunge. During downtrends many investors will give back the bulk of their bull market profits as stocks as an asset class simply go into distribution. Investors must have an exit strategy to lock in bubble profits before they burst and also not hold long positions during bear markets.

Fundamental valuations are useless during bubbles and panics while simple trend trading systems can capture big profits by putting you on the right side of the move in either direction. Trend traders have an edge during bubbles and panics because they do not need to know why a move is happening they just need a trend to happen they have the tools to capture it. Trend traders to not care about the direction or size of a trend they just want one.

“The whole world is simply nothing more than a flow chart for capital.” – Paul Tudor Jones

Trend trading tips:

· Don’t sell a market short because you think it just can’t go higher.

· Don’t buy a market just because you think it just can’t go lower.

· Trade systems designed to maximize trend profits by not having price profit targets.

· Exit a winning trade because the trend is bending.

· Let your winners run until there is a reason to exit the trade.

**************************************************************************

Week Ahead:-

Macro Data :-

Factory data announced last Friday was lower than expected. India's industrial output growth slowed to 3.8 percent in September from the month ago when factory output grew at 4.3 percent.

Manufacturing and capital goods segment showed 3.4 percent and 7.4 percent growth in September against 3.1 percent and 5.4 percent in August, but consumer durables output contracted 4.8 percent in September, against 1.6 percent in the month before.

CPI inflation due on Monday and WPI on Tuesday will be closely watched next week. Retail inflation in September was flat at 3.28 percent against August while Wholesale price inflation eased to 2.6 percent from 3.24 percent MoM.

Global cues :-

China will announce its industrial production data for October and UK will release its CPI data for October on Tuesday.

Japan will announce its preliminary GDP data for Q3 and US will release CPI data on Wednesday.


>>> Nifty Hourly Chart - Posted Last Weekly Review <<<

>>> Click the chart to see on full screen <<<


Wrote last weekly review - 10480-90 as a Key Resistance.

>>> Nifty Hourly Chart <<<

>>> Click the chart to see on full screen <<<


>>> Bank Nifty Hourly Chart - Posted on 08th Nov 2017 <<<

>>> Click the chart to see on full screen <<<

Wrote 25200 as a good support.

>>> Bank Nifty Hourly Chart <<<

>>> Click the chart to see on full screen <<<

25200 managed to Hold may find its resistance @ 25570.

>>> BATAINDIA - Daily Chart <<<

>>> Click the chart to see on full screen <<<

No Position with us. Stock moving highly volatile. Caution advised.

>>> BOSCHLTD - Daily Chart <<<

>>> Click the chart to see on full screen <<<

No Position with us. Stock moving highly volatile. Caution advised.

>>> YESBANK - Hourly Chart <<<

>>> Click the chart to see on full screen <<<

Support @ 298 & 302 - If holds - Upmove possible. Else may fall.

>>> Performance till 10th Nov, 2017 <<<


Above performance is not a Promise or guarantee for the given Profits or Loss.Performance given based on 1 lot at a time and clients Profit differ as per the margin availability and Number of Lots taken by them. We may or may not re-enter the Calls given here hit Stop Loss, as per market movement. The charts given above are just for educational purpose only and we don't recommend any Entry / Buy or Exit / Sell. Reader must taken their own decision or consult their qualified Analyst before making any decision

>>> N4A & Whatsapp <<<


Wednesday, November 08, 2017

Support @ 10285-300. Expect a Relief Rally

Dear All,

>>> Nifty Hourly Chart <<<

>>> Click the chart to see on full screen <<<

Price tested Support @ 10285 or 10300, If Holds - may rebound to test 10330-360-390.

>>> Bank Nifty Hourly Chart <<<

>>> Click the chart to see on full screen <<<

BN Tested 25200, of Holds may test 25340 & 25400. cheers!!!

Tuesday, November 07, 2017

Support @ 10350 & 10260

Dear All,

>>> Nifty Hourly Chart <<<

>>> Click the chart to see on full screen <<<

Support if breaks below 10350 - Expect to test 10260.

Monday, November 06, 2017

Resistance 10485 - Support @ 10420

Dear All,


>>> Nifty Hourly Chart - Posted on Weekly Review <<<

>>> Click the chart to see on full screen <<<

Posted on Weekly Review - Resistance @ 10485. Today Made a High of 10489.8 and Returned.

>>> Nifty Hourly Chart <<<

>>> Click the chart to see on full screen <<<

Yes We Have Shorted Today. Price if breaks below 10420 - More Correction Likely.

>>> Bank Nifty - Hourly Chart - Posted on Weekly Review <<<

>>> Click the chart to see on full screen <<<

Mentioned Price moving up for Wave X, If so - may Correct.

>>> Bank Nifty Hourly Chart <<<

>>> Click the chart to see on full screen <<<

Price unable to Hold above 25630. If breaks support @ 25530 & 2440 - More Fall likely. Cheers!!!

Sunday, November 05, 2017

Weekly Review - 06th November 2017

Dear All,


No trading system will be profitable long term without the right risk management :-

In the twenty-first century it has become fashionable to manage one’s own investments, yet few traders implement disciplined, professional money management strategies. During the stock market Dotcom bubble, limiting risk was an afterthought, but after the 2008-2009 meltdown, it showed many investors and traders that it was time to get serious about the management of their money and showed the risk that even conservative investment positions were exposed to. Professional risk and money management strategies are the foundation for success with any trading strategy. Essentially, money management tells you how many shares or contracts to trade on any given position.

For example, money management tells you whether you have enough new money to trade additional positions. Don’t confuse money management with stop placement. Stop placement does not address the how much question. Your stop shows you where the price has to go for you to exit your position but the position sizing aspect of your money management parameters will determine how much you lose if your stop loss is triggered and you exit your trade.

Here are some questions you must answer about your own money management and bet sizing:;

>> How much capital will you place on each trade? What will be your percent of total trading capital on one position?
>> What will be the maximum portfolio heat on your trading? How much could your account go down in one day? How much total risk exposure do you have?
>> Capital preservation versus capital appreciation. How much are you willing to risk in the pursuit of profits?
>> When must you take a loss to avoid larger losses? Your stop loss that results in a small loss is your insurance policy against large losses.
>> If you are on a losing streak do you trade the same? Do you decrease your trade size during losing streaks?
>> How must you prepare if trading both long and short positions? What are your signals for the long or short side?
>> Does a portfolio of long and short allow one to trade more positions? How do they correlate for total risk exposure?
>> How will your trading be adjusted with accumulated new profits? Do you trade bigger positions as your account grows? Will you have a system for withdrawing profits or
will you leave your profits in your account and compound your gains?
>> How is volatility handled? What filters for volatility will you use to adjust your position size and stop losses?
>> How do you prepare yourself psychologically? How will you manage the stress and excitement of trading to maintain your trading discipline?
>> Have you tested your bet sizing? What size of draw down do you expect during a losing streak based on your win percentage and potential losing streak?

>>> Nifty Weekly Chart <<<

>>> Click the chart to see on full screen <<<

Above 10460 - Rally may go on till 10945 and 11330. Many Sectors are breaking out and Other most Upmoved sectors also not showing any negative break down. It means - any consolidation with correction might be an another entry on longer side. Until any major fallout of Geo-Political or Economical factors, Lets travel with Trend.

>>> Nifty Daily Chart <<<

>>> Click the chart to see on full screen <<<

10460 or the channel may Resist. Else Price may trigger next level of rally till 10620 and 11330.

>>> Nifty Hourly Chart <<<

>>> Click the chart to see on full screen <<<

Hourly Chart indicates the Important of Support @ 10485, If breaks may given another 100 Points.

>>> Bank Nifty Weekly Chart <<<

>>> Click the chart to see on full screen <<<

BN if breaks above 25950 may test 26400.

>>> Bank Nifty Daily Chart <<<

>>> Click the chart to see on full screen <<<

After Recapitalization of PSU Banks - which was showing no sign of recovery - Started moving up. PSU Bank are the backbone of many industries in india. Means a revival to many companies not ruled out. Technical Resistance at 25950 & 26425.

>>> Bank Nifty Hourly Chart <<<

>>> Click the chart to see on full screen <<<

Above is an alternative with bearish scenario. As per, Price must cross above friday high for more rally. Else last upmove shall be for Wave X and correction may start any time.

>>> CNXPSUBank - Daily Chart <<<

>>> Click the chart to see on full screen <<<

Above 4190 PSU Banks looks more bullish and all PSU bank Stocks may help BN too for a Big or Good Rally.

>>> NIFTY5MIDCAP50 Daily Chart <<<

>>> Click the chart to see on full screen <<<

After announcement of bharath mala Road project by Govt. Many Infra,Steel,Power and Cement in Midcap Index Showing a Bullish Turnaround. Resistance 5215 looks important for bulls, break above may trigger next round of rally.

>>> BANKINDIA - Daily Chart <<<

>>> Click the chart to see on full screen <<<

More Rally till 220 & 250 Possible. We have no Open Positions. Just an Info.

>>> CNXPHARMA - Weekly Chart <<<

>>> Click the chart to see on full screen <<<

Pharma Index on a Major Break out - If happens - Expect a Big Bang move on all Pharma Stocks.

>>> DRREDDY - Hourly Chart <<<

>>> Click the chart to see on full screen <<<

We are Long and Above 2440 & 2465 - Expect a Fresh Rally.

>>> CNXAUTO -Daily Chart <<<

>>> Click the chart to see on full screen <<<

Above 11460 - May rally till 11850. Watch all Auto Stocks.

>>> ITC - Hourly Chart - Posted on 31st Nov, 2017 <<<

>>> Click the chart to see on full screen <<<

Wrote on 31st Nov, We are Long.

>>> ITC - Hourly Chart - Holding Long <<<

>>> Click the chart to see on full screen <<<

Holding Long still - Above 268 & 270 - More Rally on Card.

>>> N4A & Whatsapp <<<


We Provide all market related info on Whatsapp. Any new Registration should be done with Name and Location. cheerss!!!