Pages

Tuesday, November 19, 2019

NIFTY Resistance @ 11970 & 12040 - Above More Rally

Dear All,

>>> NIFTY Hourly Chart <<<

>>> click the chart to see on full screen <<<

We are Holding LONG.

>>> Bank of Baroda - Hourly Chart - We are Holding LONG <<<

>>> click the chart to see on full screen <<<

We are Holding LONG

Sunday, November 17, 2019

Weekly Review - 18th Nov 2019

Dear All,

>>> NIFTY Hourly Chart <<<

>>> Click the chart to see on full screen <<<

More rally Possible. We are Holding LONG.

>>> Bank NIFTY Hourly Chart <<<

>>> Click the chart to see on full screen <<<

Watch Resistance.

>>> INFY - Profit made Rs.15000/- No Holdings Now <<<

>>> Click the chart to see on full screen <<<

No Holdings Now.

>>> WeekEnd Performance till 15th Nov 2019 <<<

>>> Click the chart to see on full screen <<<

Above performance is not a Promise or guarantee for the given Profits or Loss.Performance given based on 1 lot at a time and clients Profit differ as per the margin availability and Number of Lots taken by them. We may or may not re-enter the Calls given here hit Stop Loss, as per market movement. The charts given above are just for educational purpose only and we don't recommend any Entry / Buy or Exit / Sell. Reader must taken their own decision or consult their qualified Analyst before making any decision

Sunday, November 10, 2019

Weekly Review - 11th Nov, 2019

Dear All,

>>> NIFTY Hourly Chart <<<

>>> Click the chart to see on full screen <<<

Just some more consolidation may take place. Supports if holds, may again take a reversal.

>>> Bank NIFTY Hourly Chart <<<

>>> Click the chart to see on full screen <<<


>>> Maruti - Profit Booked Rs.15000 <<<

>>> Click the chart to see on full screen <<<


Above chart sent to our client as 04th Nov 2019, Booked with Rs.15000/-. No Holdings now.

>>> WeekEnd Performance till 08th Nov 2019 <<<


Above performance is not a Promise or guarantee for the given Profits or Loss.Performance given based on 1 lot at a time and clients Profit differ as per the margin availability and Number of Lots taken by them. We may or may not re-enter the Calls given here hit Stop Loss, as per market movement. The charts given above are just for educational purpose only and we don't recommend any Entry / Buy or Exit / Sell. Reader must taken their own decision or consult their qualified Analyst before making any decision

Sunday, November 03, 2019

Weekly Review 04th November, 2019

Dear All,

>>> NIFTY Daily Chart <<<

>>> Click the chart to see on full screen <<<

Key Resistance @ 11990 & 12115. Keep watching.

>>> NIFTY Hourly Chart <<<

>>> Click the chart to see on full screen <<<

Watch Resistance & Support

>>> Bank NIFTY Daily Chart <<<

>>> Click the chart to see on full screen <<<

Watch Key Resistance @ 30800 & 31140.

>>> Bank NIFTY Hourly Chart <<<

>>> Click the chart to see on full screen <<<

Watch Support & Resistance.

>>> Federal Bank - Profit Booked with Rs.28000/- <<<

>>> Click the chart to see on full screen <<<

No Holdings. Profit Booked with Rs.28000/- Watch Next Resistance.

>>> Performance for the month end of October 2019 <<<


Above performance is not a Promise or guarantee for the given Profits or Loss.Performance given based on 1 lot at a time and clients Profit differ as per the margin availability and Number of Lots taken by them. We may or may not re-enter the Calls given here hit Stop Loss, as per market movement. The charts given above are just for educational purpose only and we don't recommend any Entry / Buy or Exit / Sell. Reader must taken their own decision or consult their qualified Analyst before making any decision


Wednesday, October 30, 2019

Is this a Evening Star ???

Dear All,

>>> NIFTY Daily Chart <<<


>>> Click the chart to see on full screen <<<


If this is a Evening Star and If this is a Warning Sign, We will have the Result from tomorrow. Lets See.

Saturday, October 26, 2019

Happy Diwali.

Dear All,

>>> NIFTY Hourly Chart <<<

>>> Click the chart to see on full screen <<<

Watch Resistance for More Rally.

>>> Bank NIFTY Hourly Chart <<<

>>> Click the chart to see on full screen <<<

Watch Resistance for Rally

>>> Diwali Offer <<<


Monday, October 21, 2019

Is this a FAKE Break Out ?!?!?!?!

Dear All,

>>> NIFTY DAILY CHART <<<
>>> Click the chart to see on full screen <<<

Wait for confirmation - Else ????


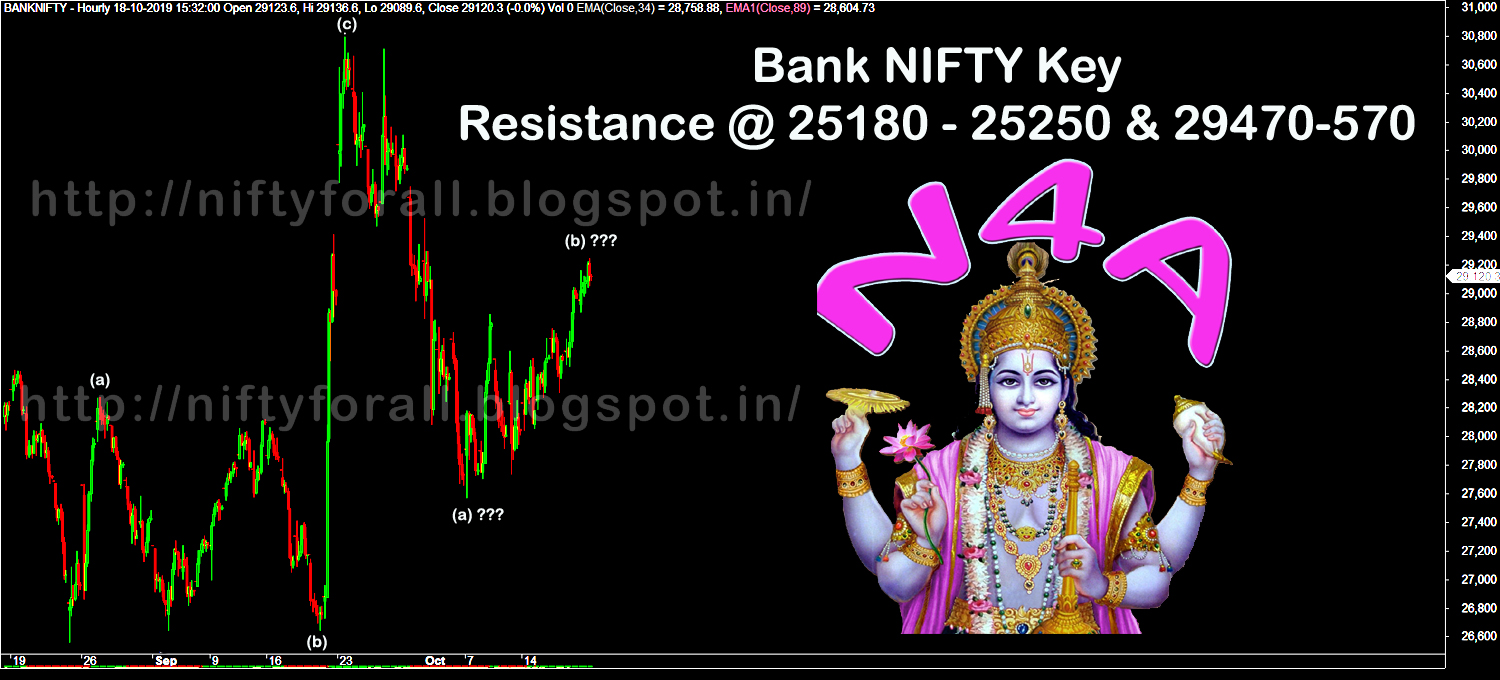
>>> Bank Nifty Hourly Chart <<<


>>> Diwali Offer with N4A <<<

Wednesday, October 16, 2019

NIFTY :- Key Resistance @ 11465 & 11565

Dear All,

>>> NIFTY Daily Chart <<<

>>> Click the chart to see on full screen <<<

Watch Support & Resistance.

Saturday, October 12, 2019

Weekly Review - 14th Oct 2019

Dear All,

>>> NIFTY Weekly Chart <<<

>>> Click the chart to see on full screen <<<

On Weekly Chart - On a Medium to Longer time Frame - NIFTY may test 13K Soon.

>>> NIFTY Daily Chart <<<

>>> Click the chart to see on full screen <<<
If this is a "IHS" Pattern - Expect a Good Rally.

>>> NIFTY Hourly Chart <<<

>>> Click the chart to see on full screen <<<

On Hourly Chart - its a Falling Wedge, Hence More chances to Bullish Rally soon.

>>> Bank NIFTY Daily Chart <<<

>>> Click the chart to see on full screen <<<

Watch Support.

>>> Coal India - Hourly Chart - Holding Long <<<

>>> Click the chart to see on full screen <<<

Yes We are Holding LONG.

>>> Special Diwali Offer is Ready <<<

Just Whatsapp @ 9677924975 or Email to niftyforall@yahoo.com for more details.

>>> N4A & Whatsapp <<<


Wednesday, October 09, 2019

NIFTY Resistance @ 11400

Dear All,

>>> NIFTY Hourly Chart <<<

>>> Click the chart to see on full screen <<<

We are Holding LONG. Next Resistance @ 11400

Wednesday, October 02, 2019

Weekly Review 03rd Oct 2019

Dear All,

>>> NIFTY Daily Chart <<<

>>> Click the chart to see on full screen <<<

Daily Chart suggest more consolidation with correction. Watch Support.

>>> NIFTY Hourly Chart <<<

>>> Click the chart to see on full screen <<<

Its a Flag & Pole Pattern - with WXY count. More Volatile Move Possible.

>>> Bank NIFTY Daily Chart <<<

>>> Click the chart to see on full screen <<<

Watch Support

>>> Bank NIFTY Hourly Chart <<<

>>> Click the chart to see on full screen <<<

Watch Support & Resistance.

>>> N4A & Whatsapp <<<

Sunday, September 29, 2019

NIFTY :- Support @ 11490 & 11460

Dear All,

>>> NIFTY 15 Mins Chart <<<

>>> Click the chart to see on full screen <<<


Watch Support.

>>> Month End Performance for the month end of Sep 2019 <<<

>>> Click the image to see on full screen <<<

Above performance is not a Promise or guarantee for the given Profits or Loss.Performance given based on 1 lot at a time and clients Profit differ as per the margin availability and Number of Lots taken by them. We may or may not re-enter the Calls given here hit Stop Loss, as per market movement. The charts given above are just for educational purpose only and we don't recommend any Entry / Buy or Exit / Sell. Reader must taken their own decision or consult their qualified Analyst before making any decision

Thursday, September 26, 2019

NIFTY Spot Resistance @ 11590 & 11610 Above More Rally

Dear All,

>>> NIFTY Hourly Chart <<<

>>> click the chart to see on full sceen <<<

Above Resistance 11590 & 11610 - More Rally on Card. We are Holding LONG

Sunday, September 22, 2019

Weekly Review - 23rd Sep 2019

Dear All,

>>> NIFTY Daily Chart <<<

>>> Click the chart to see on full screen <<<

As expected the pattern now reflecting a Head & Shoulder. Since the Rally was so fast and powerful, any reversal or trade on that basis should be done only after confirmation only. Lets wait for it. We have booked all long and no Open positions now.

>>> NIFTY Hourly Chart - Published to our Client as on 17th Sep 2019 <<<

>>> Click the chart to see on full screen <<<

Its a Expected Rally for us, As we have send to our client as on 17th Sep 2019 - Mentioned a 400 Points Rally is waiting. Only surprise is it happened in Just a Day.

>>> NIFTY Hourly Chart - Whats Next ? <<<

>>> Click the chart to see on full screen <<<

Watch Key Resistance for next move.

>>> Week End Performance as on 20th Sep 2019 <<<

Sunday, September 15, 2019

Weekly Review - 16th Sep, 2019

Dear All,

>>> NIFTY Daily Chart <<<

>>> Click the chart to see on full screen <<<

NIFTY forming a Right Shoulder - in that case - We may see a temporary Reversal

>>> NIFTY Hourly Chart <<<

>>> Click the chart to see on full screen <<<

Friday Price took support near 10950 and reversed, If price manages to cross above 11080 & 11115 may test remaining Resistance as given on chart, else may test the support on the downside. Below 10920 - Free fall.

>>> Bank NIFTY Daily Chart <<<

>>> Click the chart to see on full screen <<<

BANKNIFTY forming a Right Shoulder - in that case - We may see a temporary Reversal


>>> Bank NIFTY Hourly Chart <<<

>>> Click the chart to see on full screen <<<

Key Support @ 27570 - 27440 - 27300 - if breaks - may fall more.

>>> NIFTY PSU Bank Index - Daily Chart <<<

>>> Click the chart to see on full screen <<<

Watch all PSU Bank Stocks.

>>> Weekend Performance till 13th Sep 2019 <<<

>>> Click the image to see on full screen <<<

Above performance is not a Promise or guarantee for the given Profits or Loss.Performance given based on 1 lot at a time and clients Profit differ as per the margin availability and Number of Lots taken by them. We may or may not re-enter the Calls given here hit Stop Loss, as per market movement. The charts given above are just for educational purpose only and we don't recommend any Entry / Buy or Exit / Sell. Reader must taken their own decision or consult their qualified Analyst before making any decision