Pages

Saturday, March 04, 2017

Weekly Review - 06th March, 2017

Dear All,


A surprisingly positive gross domestic product (GDP) growth data and globally US President Donald Trump’s non-combative speech to Congress may have taken the market to two-year high on the fourth trading day, the benchmark indices snapped five-week long gaining spree to end in red terrain as investors preferred to book profits ahead of the US Federal Reserve’s policy meeting on March 14-15 and back home state election results due on March 11.

To the surprise of economists and market participants, the Central Statistic Office (CSO) on Tuesday showed that GDP expanded by 7% in the third quarter, belying all fears of the demonetisation derailing economic activity. The pace of the growth, however, slowed from 7.4% logged in the September quarter, but CSO retained its first advance growth estimate for the entire financial year 2016-17 at 7.1%.

Meanwhile, Nikkei India Manufacturing Purchasing Managers’ Index (PMI) inched up to 50.7 in February from 50.4 in January, while Nikkei India Services PMI stood at 50.3 in February, up from 48.7 registered in January.

The US Federal Reserve looks set to hike interest rates in its next policy meeting on March 14-15 as leading policymakers including Chair Janet Yellen indicating the global economy seemed to have turned a corner, clearing the way for a rate hike “fairly soon”.

Yellen, in a speech on Friday signaled the Fed is set to raise interest rates this month if employment and other economic data hold up. She also said rates are likely to rise faster this year.

Traders now have priced in about an 85% chance of a hike during the March 14-15 policy-setting meeting, according to Thomson Reuters data. Those chances stood at roughly 30% at the start of the week.

>>> Nifty Weekly Chart <<<

>>> Click the chart to see on full screen <<<

Price must cross above the trend line to confirm the bulls march.

>>> Nifty Daily Chart <<<

>>> Click the chart to see on full screen <<<

8860 Supported Friday - though RSI gave a Sell Signal - Still Price need to confirm.

>>> Nifty Hourly Chart <<<


>>> Click the chart to see on full screen <<<

100 HMA so far or Even on Friday saved Bulls.

>>> Bank Nifty Weekly Chart <<<

>>> Click the chart to see on full screen <<<

If this is a Dark Cloud Cover - its a Warning sign from bear !!!

>>> Bank Nifty Daily Chart <<<

>>> Click the chart to see on full screen <<<

Price yet to break the trend line to support bear.

>>> Bank Nifty Hourly Chart <<<

>>> Click the chart to see on full screen <<<

Price need to hold 20460 for any strength to Bulls, else bear may gain strength again.

>>> CNX-IT - Daily <<<

>>> Click the chart to see on full screen <<<

We are advising Short on IT Nifty since last several days. Below news about H1B Visa Suspension may trigger a sell off in IT Index and Stocks Next Week.

The US government has temporarily suspended issuing premium H1B visas with effect from April 3, 2017. The US Citizenship and Immigration Services (USCIS) notification, however, said the pending applications for premium H1B visas and the ones filed before April 3 will be processed.
"The temporary suspension applies to all H1B petitions filed on or after April 3, 2017. Since FY18 cap-subject H1B petitions cannot be filed before April 3, 2017, this suspension will apply to all petitions filed for the FY18 H-1B regular cap and master’s advanced degree cap exemption,” noted in the USCIS ruling.
This means that the IT services firms cannot send their employees on urgent project requirement after April 3, thereby impacting their quarterly business numbers.

While US President Trump had called for tougher immigration laws for technology companies, and had threatened to impose taxes on companies that moved work offshore, in his first State of the Union address to a joint session of the US Congress last week, he proposed for having a merit-based immigration system like Canada, Australia and other nations.

>>> BHARATFIN - Posted on 27th Feb, 2017 <<<

>>> Click the chart to see on full screen <<<

Posted on 27th Feb, 2017 We have shorted BhartFin. See what happened.

>>> BHARATFIN - Booked Profit Rs.14000/- <<<

>>> Click the chart to see on full screen <<<

Booked 14K and mentioned that Price may fall more, if breaks below the channel as shown on chart. As mentioned price tested 757 low.

>>> BIOCON - Posted on 28th Feb, 2017 <<<

>>> Click the chart to see on full screen <<<

Posted on 28th Feb, 2017 - Biocon may correct badly.

>>> BIOCON - Booked Profit Rs.30,000/- <<<

>>> Click the chart to see on full screen <<<

Biocon - Booked Profit Rs.30,000/-

>>> JETAIRWAYS - Posted on 01st March, 2017 <<<

>>> Click the chart to see on full screen <<<

Posted on 01st March, 2017 - Price may correct.

>>>> JETAIRWAYS - Booked Profit Rs.22000/- <<<<

>>> Click the chart to see on full screen <<<

Booked Profit Rs.22000/-

>>> GRANULES - Booked Profit Rs.30,000/- on Short <<<

>>> Click the chart to see on full screen <<<

Shorted and Booked Profit Rs.30,000/-

>>> SBIN - Posted on 02nd March, 2017 <<<

>>> Click the chart to see on full screen <<<

Posted on 02nd March, 2017 for a Correction.

>>> SBIN - Booked Profit Rs.21000/- <<<

>>> Click the chart to see on full screen <<<

Booked Profit Rs.21000/-

>>> Performance for March month till 03rd March, 2017 <<<

>>> Click the image to see on full screen <<<

Above performance is not a Promise or guarantee for the given Profits or Loss.Performance given based on 1 lot at a time and clients Profit differ as per the margin availability and Number of Lots taken by them. We may or may not re-enter the Calls given here hit Stop Loss, as per market movement. The charts given above are just for educational purpose only and we don't recommend any Entry / Buy or Exit / Sell. Reader must taken their own decision or consult their qualified Analyst before making any decision.

>>> N4A - Services <<<

>>> Click the image to see on full screen <<<

Send your queries about our services to niftyforall@yahoo.com or whatsapp @ 9677924975

Thursday, March 02, 2017

Support @ 8885 & 8815

Dear All,

>>> Nifty Hourly Chart <<<

>>> Click the chart to see on full screen <<<

For the second time - Price broken the trend line or wedge like pattern. Now support @ 8885 & 8815.

>>> Biocon - Posted on 28th Feb, 2017 <<<

>>> Click the chart to see on full screen <<<

Wrote on Tuesday - We have shorted Biocon and looking for a Correction. See what happened.

>>> Biocon - Booked Profit Rs.30,000/- <<<

>>> Click the chart to see on full screen <<<

Booked Profit near 1075 with Rs.30,000/- More fall likely till the lower end of the channel.

>>> JetAirways - Posted Yesterday for Correction <<<

>>> Click the chart to see on full screen <<<

Posted Yesterday - Wrote we have shorted for a good correction. See what happened.

>>> JetAirways - Profit Booked @ 425 With Rs.22000/- <<<

>>> Click the chart to see on full screen <<<

Booked Profit @ 425 with Rs.22000/-

>>> GRANUELS - Shorted & Booked Profit With Rs.30,000/- <<<

>>> Click the chart to see on full screen <<<

Price Hit 128 and Booked Rs.30,000. We took short @ 134 Y'day. No Position Now.

>>> SBI - Looking for a Correction <<<

>>> Click the chart to see on full screen <<<

Have Shorted Today for a Good Correction. Cheers!!!

Wednesday, March 01, 2017

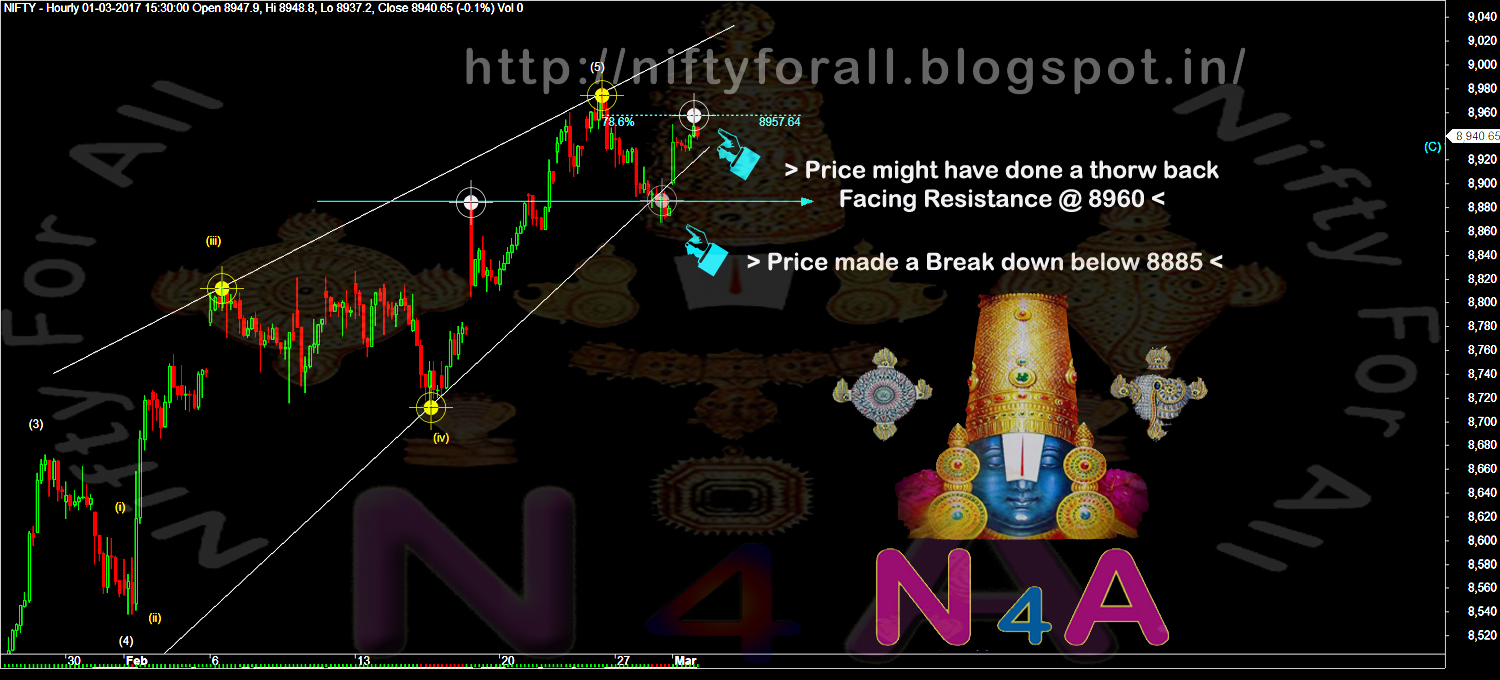
Resistance @ 8960 & 8980

Dear All,

>>> Nifty Hourly Chart <<<

>>> Click the chart to see on full screen <<<

Hope today's rally was a throw back and have resisted @ 8960, If so - Earlier Break down may give result for a meaningful correction in coming days.

>>> JETAIRWAYS - Time for Landing??? <<<

>>> Click the chart to see on full screen <<<

Almost "ABC" Completed in Jetairways - If not wrong - Expect a landing on Jet. Cheers!!!

Tuesday, February 28, 2017

Next Support @ 8830

Dear All,

>>> Nifty Hourly Chart <<<

>>> Click the chart to see on full screen <<<

As wrote Yesterday 8885 broken and Next Support @ 8830.

>>> BHARATFIN - Booked Profit Rs.14000/- <<<

>>> Click the chart to see on full screen <<<

Booked today near 848 with Rs.14000/- Price if breaks below the channel as shown above - may trigger more fall. We have no Open Position.

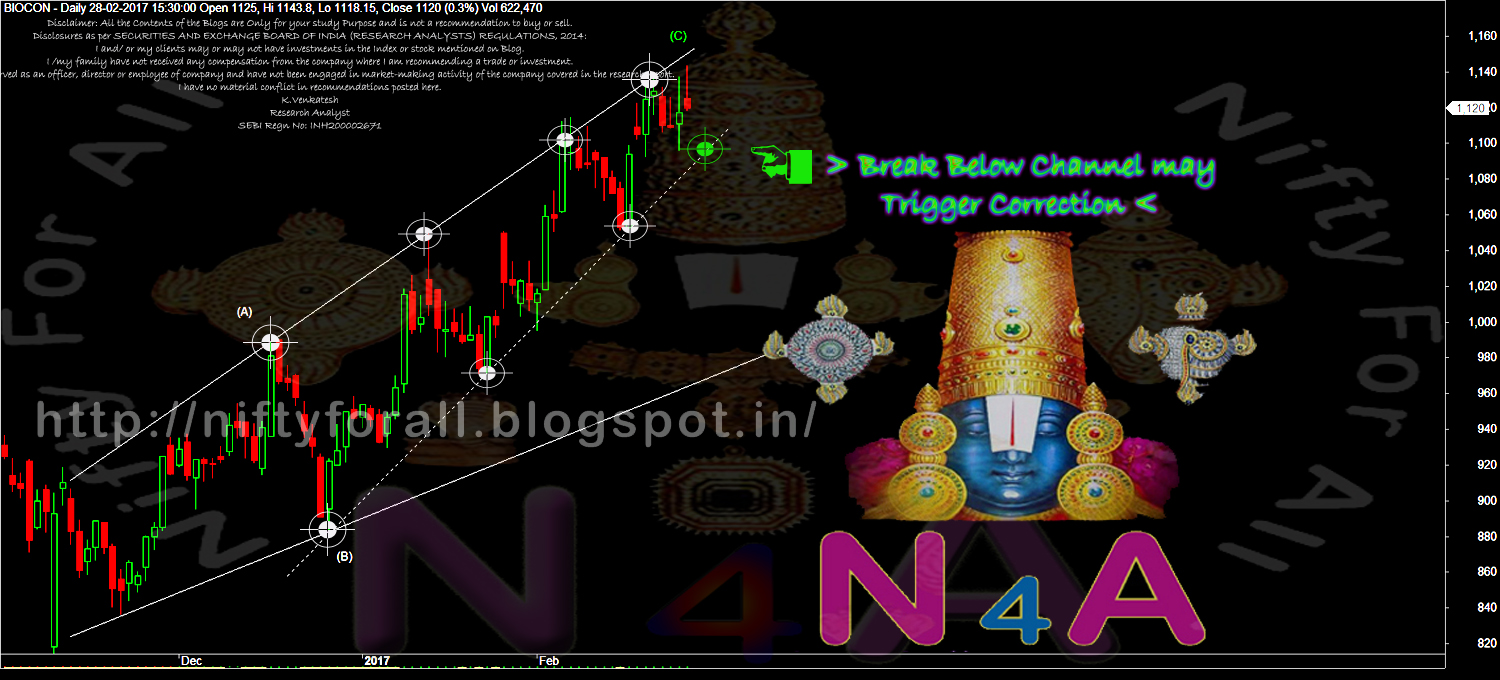
>>> BIOCON - Correction Ahead <<<

>>> Click the chart to see on full screen <<<

Biocon - May correct if it can break below the channel - As shown above. Lets See. Cheers!!!

Monday, February 27, 2017

Support @ 8885

Dear All,

>>> Nifty Hourly Chart - Support @ 8885 - If breaks - May Start Falling <<<

>>> Click the chart to see on full screen <<<

Price must hold 8885 to bounce back again.

>>> Bank Nifty Hourly Chart - Support @ 20460 - If Breaks - Fall to Continue <<<

>>> Click the chart to see on full screen <<<

20460 - If Holds - May start Recovering.

>>> BHARATFIN - We have Shorted Today <<<

>>> Click the chart to see on full screen <<<

Price may continue to fall if breaks below the channel as shown on chart. We have Short Position. Cheers!!!

Sunday, February 26, 2017

Weekly Review - 27th Feb, 2017

Dear All,


Overseas investors have pumped in over Rs 14,600 crore into the Indian capital markets this month so far, enthused by clarity on FPI taxation. The latest inflow followed a net pullout of Rs 80,310 crore from equity and debt together in the past four months (October-January). Prior to that, FPIs had invested over Rs 20,000 crore in the capital market in September 2016.

According to depository data, foreign portfolio investors (FPIs) infused a net sum of Rs 9,359 crore in equities during February 1-23 and another Rs 5,279 crore in the debt segment, translating into a total inflow of Rs 14,638 crore.

>>> Nifty Daily Chart - Posted Last Weekly Review <<<

>>> Click the chart to see on fulls screen <<<

Wrote last weekly review - 8890 and 8940 - resistance - above rally may continue.

>>> Nifty Daily Chart <<<

>>> Click the chart to see on fulls screen <<<

Price tested 8980.

>>> Nifty Hourly Chart <<<

>>> Click the chart to see on fulls screen <<<

Price completed 1-5 rally, tested 8980.

>>> Bank Nifty Daily Chart <<<

>>> Click the chart to see on fulls screen <<<

As mentioned last weekly review also - bank nifty possibly completed 1-5 rally as shown above, may face resistance @ 21040 & 21080 on the higher side.

>>>Bank Nifty Hourly Chart <<<

>>> Click the chart to see on fulls screen <<<

21040 & 21080 to remain as an important resistance.

>>> CNX-IT Daily Chart - Posted on 21st Feb, 2017 - Shorted <<<

>>> Click the chart to see on fulls screen <<<

Posted on 21st feb, Price may correct and we have shorted also.


>>> CNX-IT Daily Chart - Holding Short <<<

>>> Click the chart to see on fulls screen <<<

We are holding short still for a good correction.

>>> Performance for the month end of Feb, 2017 <<<

>>> Click the image to see on fulls screen <<<

Above performance is not a Promise or guarantee for the given Profits or Loss.Performance given based on 1 lot at a time and clients Profit differ as per the margin availability and Number of Lots taken by them. We may or may not re-enter the Calls given here hit Stop Loss, as per market movement. The charts given above are just for educational purpose only and we don't recommend any Entry / Buy or Exit / Sell. Reader must taken their own decision or consult their qualified Analyst before making any decision


Wednesday, February 22, 2017

Support 8885-90

Dear All,

>>> Nifty Hourly Chart <<<

>>> Click the chart to see on full screen <<<

Price if breaks below 8885-90 may see a correction, else may test 8940 or 8980.

>>> CNX-IT Posted on 21st Feb, 2017 <<<

>>> Click the chart to see on full screen <<<

Wrote Yesterday - Price may find its resistance @ channel top.

>>> CNX-IT - Have Entered Short Today <<<

>>> Click the chart to see on full screen <<<

Shorted today and Holding for a Good Correction. Cheers!!!

Tuesday, February 21, 2017

Resistance @ 8940 & 8980

Dear All,

>>> Nifty Hourly Chart <<<

>>> Click the chart to see on full screen <<<

Price closed above 8890 - Our Resistance mentioned on Weekly Review and Previous Updates. Now Price may find its Resistance again near 8940 and 8980.

>>> Bank Nifty Hourly Chart <<<


Sunday, February 19, 2017

Weekly Review - 20th February 2017

Dear All,

Markets on Friday clocked their fourth straight weekly gain amid positive global investor sentiment and by gains in HDFC Bank and Sun Pharmaceuticals.

Sentiment also got a boost after RBI Governor Urjit Patel said India’s economic growth will make a “sharp V” recovery after a short drop in the aftermath of demonetisation.

The central bank put HDFC Bank back on the FII ban list after foreign shareholding exceeded the prescribed limit of 74% within hours of trading.

Earning is a big factor which can influence stock prices. The fear which clouded Indian markets in the name of demonetisation and Trumponomics seems to have receded. The DeMon or demonetisation could show its ugly face in March quarter results. The recent run-up in the Indian market may not sustain without better support from earnings and fundamentals. “The December quarter saw a strong recovery in earnings from a very low base in several sectors but underlying trends continue to be subdued with demonetisation adding to the woes.

The next week will be truncated, as stock exchanges will be closed on Tuesday on account of Municipal Corporation Elections in Mumbai and, on Friday, on account of Mahashivratri. But volatility is expected to rise ahead of expiry of February series futures and options contracts on Thursday.

Further progress on GST is necessary on GST in the Budget session of Parliament for its implementation in H1FY18. A positive outcome for BJP in the state elections may lead the markets higher, at least in the short term.


>>> Nifty Weekly Chart - Bear Warning ??? <<<

>>> Click the chart to see on full screen <<<

Its a Red Doji near the trend line again, Might be a Caution sign from Bear.

>>> Nifty Daily - Posted on February - First Weekly Update - 04th Feb, 2017 <<<

>>> Click the chart to see on full screen <<<

Wrote on 04th Feb, 2017 - Nifty had Two choice 8770 or 8890. Second Alternative achieved today - made a high of 8885. so whats Next ?

>>> Nifty Daily Chart - What's Next <<<

>>> Click the chart to see on full screen <<<

If the above analysis is not wrong - Price has completed ABC wave and may start a possible correction any time. Else may trigger next round of rally.

>>> Nifty Hourly chart - Two Alternatives <<<

>>> Click the chart to see on full screen <<<

Above 8890 - another rally may start.

>>> Bank Nifty Weekly Chart - Bear Warning ??? <<<

>>> Click the chart to see on full screen <<<

Price might have completed 1 to 5 rally, If this is not wrong, Expect a correction. Else the count analysis may get truncated.

>>> Bank Nifty Daily Chart <<<

>>> Click the chart to see on full screen <<<

Price Spike only for a Single Stock - No major news on Sector Wise - So far Results are also not encouraging for many banks.

>>> Bank Nifty Hourly Chart <<<

>>> Click the chart to see on full screen <<<

20450-460 If holds - Price may try to breach one more high. Else may start correcting.

>>> CNX-IT Daily Chart <<<

>>> Click the chart to see on full screen <<<

Price may find its resistance at channel top as shown on chart.

>>> AdaniPort - Hourly - Posted on 15th Feb, 2017 - We had Short Position <<<

>>> Click the chart to see on full screen <<<

Posted on 15th Feb, 2017 - Wrote Price may correct.

>>> AdaniPort - Hold Your Shorts for more fall <<<

>>> Click the chart to see on full screen <<<

Hold Your Shorts and Price may test the channel support any time.

>>> Performance till 17th Feb, 2017 <<<

>>> Click the image to see on full screen <<<

Above performance is not a Pomise or guarantee for the given Profits or Loss.Performance given based on 1 lot at a time and clients Profit differ as per the margin availability and Number of Lots taken by them. We may or may not re-enter the Calls given here hit Stop Loss, as per market movement. The charts given above are just for educational purpose only and we don't recommend any Entry / Buy or Exit / Sell. Reader must taken their own decision or consult their qualified Analyst before making any decision

>>> N4A - Service <<<

Thursday, February 16, 2017

8715 Holding. Resistance @ 8830-8840

Dear All,

>>> Nifty Hourly Chart <<<

>>> Click the chart to see on full screen <<<

8715 holding and if breaks above 8830-40 - Rally may again resume.


Wednesday, February 15, 2017

Watch 8715 & 8670

Dear All,

>>> Nifty Hourly Chart <<<

>>> Click the chart to see on full screen <<<

Watch 8715 and 8670 for Clarity.

>>> AdaniPort - Short Triggered <<<

>>> Click the chart to see on full screen <<<

Finally Broken down the wedge - We have shorted and waiting for a Good Correction. Cheers!!!

Tuesday, February 14, 2017

8750 & 8715 Still Holding !!!

Dear All,

>>> Nifty Hourly Chart <<<

>>> Click the chart to see on full screen <<<

Channel Support or 8750 & 8715 must hold as per above chart.

>>> Hindalco - Posted on Weekly Review <<<

>>> Click the chart to see on full screen <<<

Wrote on Weekly Review - Expect a bounce back on Hindalco. We are Long.

>>> Hindalco - Hold Long <<<

>>> Click the chart to see on full screen <<<

Hold Long - Break above 188.50 may trigger a fresh Rally & Short Covering. Cheers!!!

Monday, February 13, 2017

Support @ 8715 & 8750.

Dear All,

>>> Nifty Hourly Chart <<<

>>> Click the chart to see on full screen <<<

Key Support 8750 & 8715 if Holds - May give one more rally.


>>> MindTree - Profit Booked Rs.24000/- <<<

>>> Click the chart to see on full screen <<<

We have booked our Long with Rs.24000/- Profit. Price if managed to trade above 472, may rally till channel top - as shown on chart. Cheers!!!